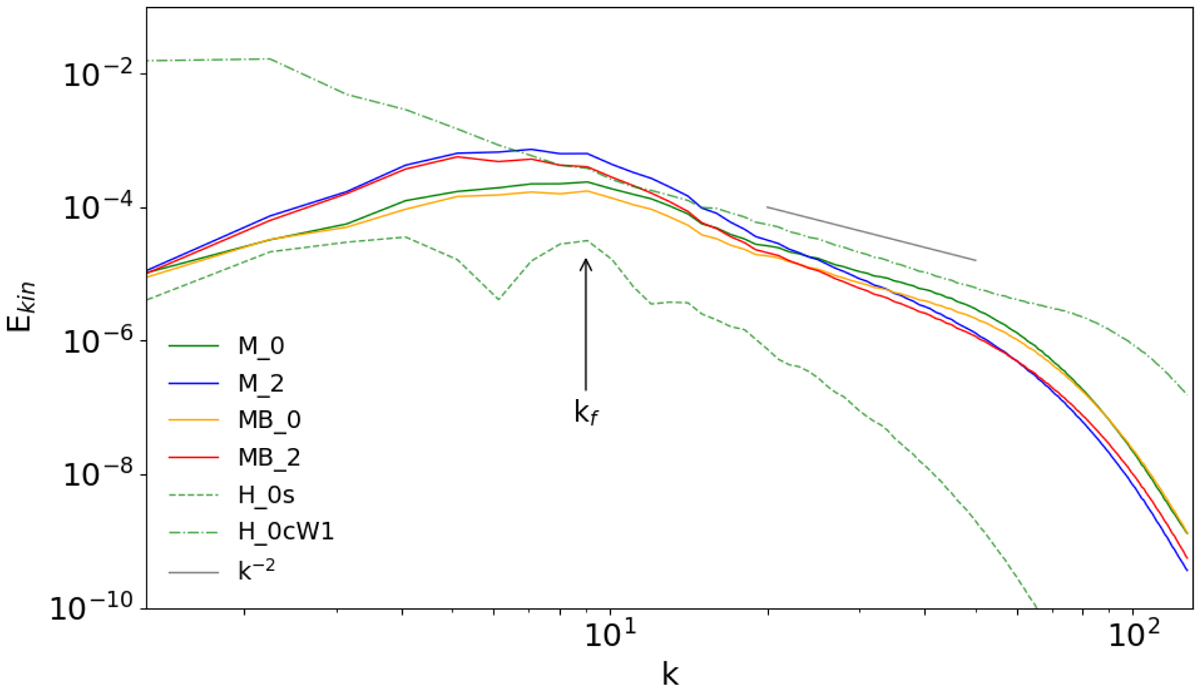
Fig. 3.
Download original image
Time-averaged kinetic spectra at saturation of some representative simulations of Tables 1–3. We notice how the results on large scales (small k) are very similar for all the models, excluding H_0cW1 (dash-dotted green line), which has a forcing with kf = 2. The spectrum with lowest power is H_0s (dashed green line), which has Δt = 1. Models marked with other colors explore variation of Ω and EoS. In all these models the magnetic field decays rapidly and kinetic spectra coincide with the corresponding HD runs of Fig. 2.
Current usage metrics show cumulative count of Article Views (full-text article views including HTML views, PDF and ePub downloads, according to the available data) and Abstracts Views on Vision4Press platform.
Data correspond to usage on the plateform after 2015. The current usage metrics is available 48-96 hours after online publication and is updated daily on week days.
Initial download of the metrics may take a while.