Fig. 9
Download original image
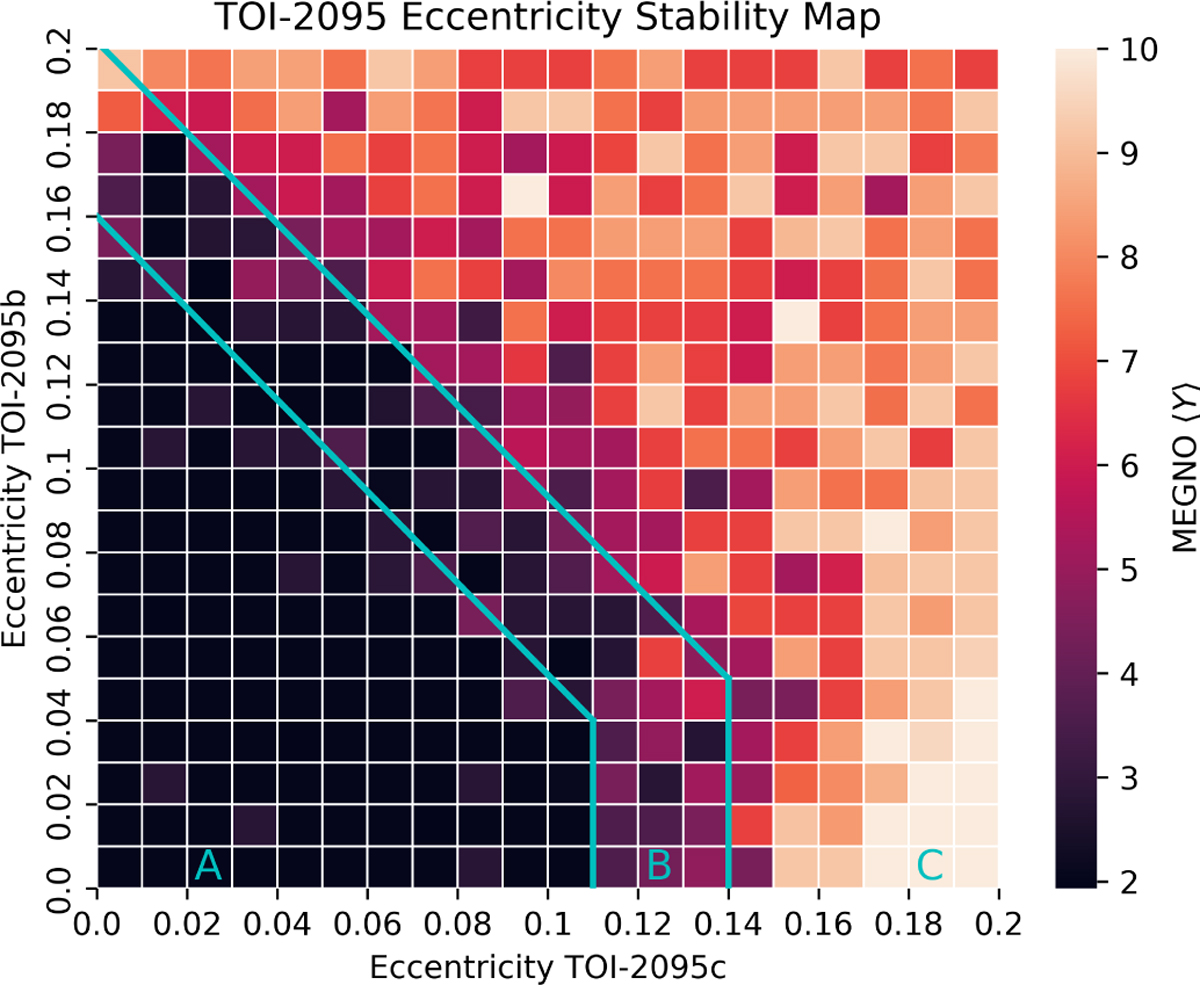
Stability map of the TOI-2095 system in the eb – ec parameter space based on the MEGNO chaos indicator. The map consists of a 20 × 20 grid, where each grid cell is the average of 10 realizations with randomized mean anomalies and arguments of periastron. The three regions of differing stability (A, B, C) are marked with letters and are described by Eqs. (5) and (6).
Current usage metrics show cumulative count of Article Views (full-text article views including HTML views, PDF and ePub downloads, according to the available data) and Abstracts Views on Vision4Press platform.
Data correspond to usage on the plateform after 2015. The current usage metrics is available 48-96 hours after online publication and is updated daily on week days.
Initial download of the metrics may take a while.