Fig. 5
Download original image
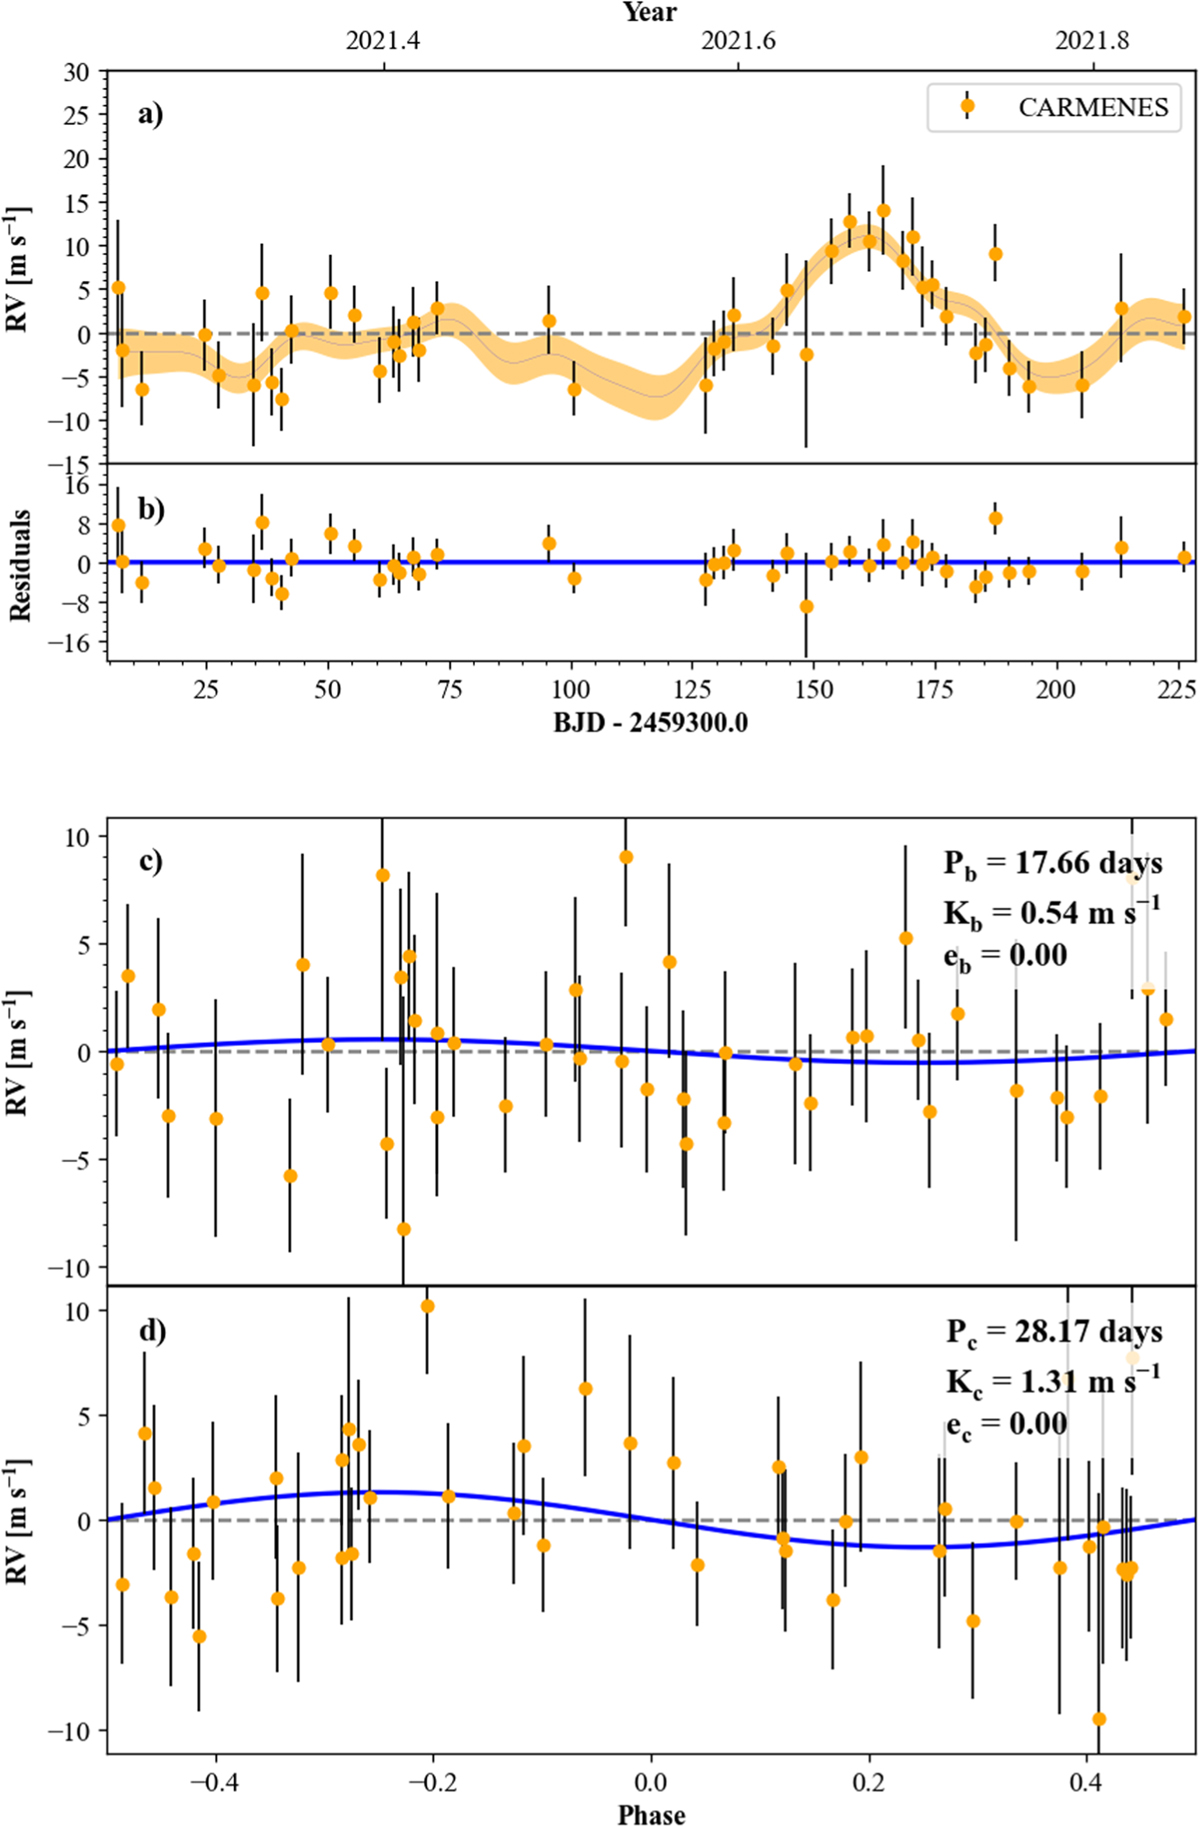
Radial velocity measurements of TOI-2095 taken with CARMENES. (a): RV time series and best-fitting model (blue line) including red noise. The plotted RV model was computed using the median values of the posterior distribution for each fitted parameter. The shaded area around the blue line represent the 1σ uncertainty levels of the fitted model. (b): residuals of the fit after subtracting the two planet models. (c) and (d): phase-folded RV measurements after subtracting the red noise and best-fit model (blue line).
Current usage metrics show cumulative count of Article Views (full-text article views including HTML views, PDF and ePub downloads, according to the available data) and Abstracts Views on Vision4Press platform.
Data correspond to usage on the plateform after 2015. The current usage metrics is available 48-96 hours after online publication and is updated daily on week days.
Initial download of the metrics may take a while.