Open Access
Fig. 4
Download original image
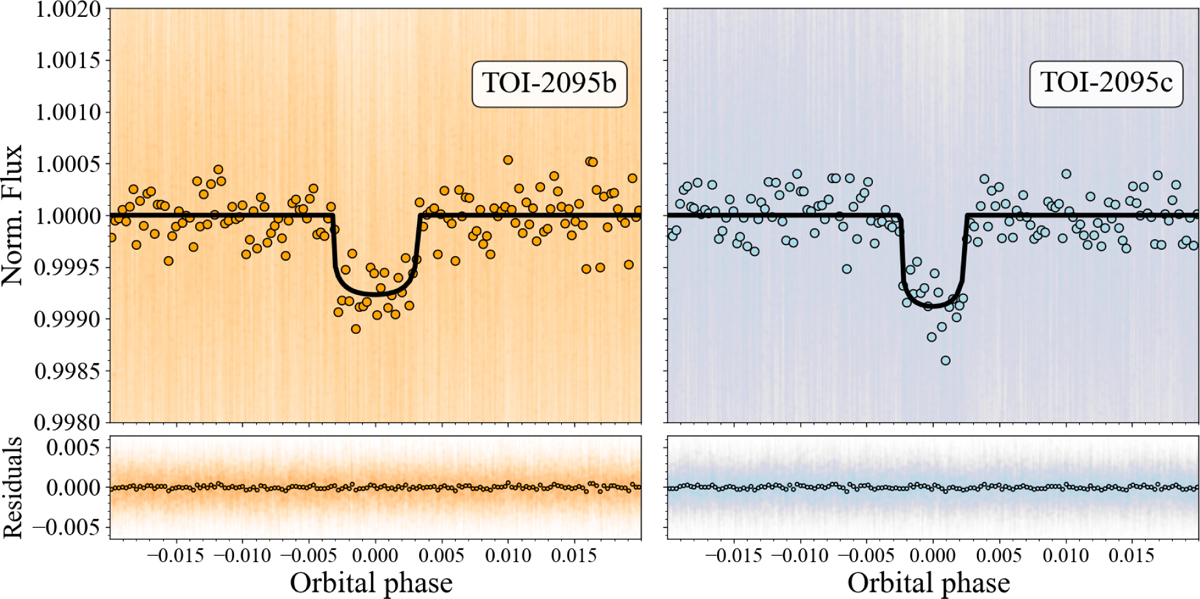
TESS phase-folded light curves after subtracting the photometric variability for TOI-2095b (top left) and TOI-2095c (top right). The best-fit model is shown in black, the circles are TESS binned data points, and the points are individual TESS observations. Bottom panels: residuals of the fit.
Current usage metrics show cumulative count of Article Views (full-text article views including HTML views, PDF and ePub downloads, according to the available data) and Abstracts Views on Vision4Press platform.
Data correspond to usage on the plateform after 2015. The current usage metrics is available 48-96 hours after online publication and is updated daily on week days.
Initial download of the metrics may take a while.