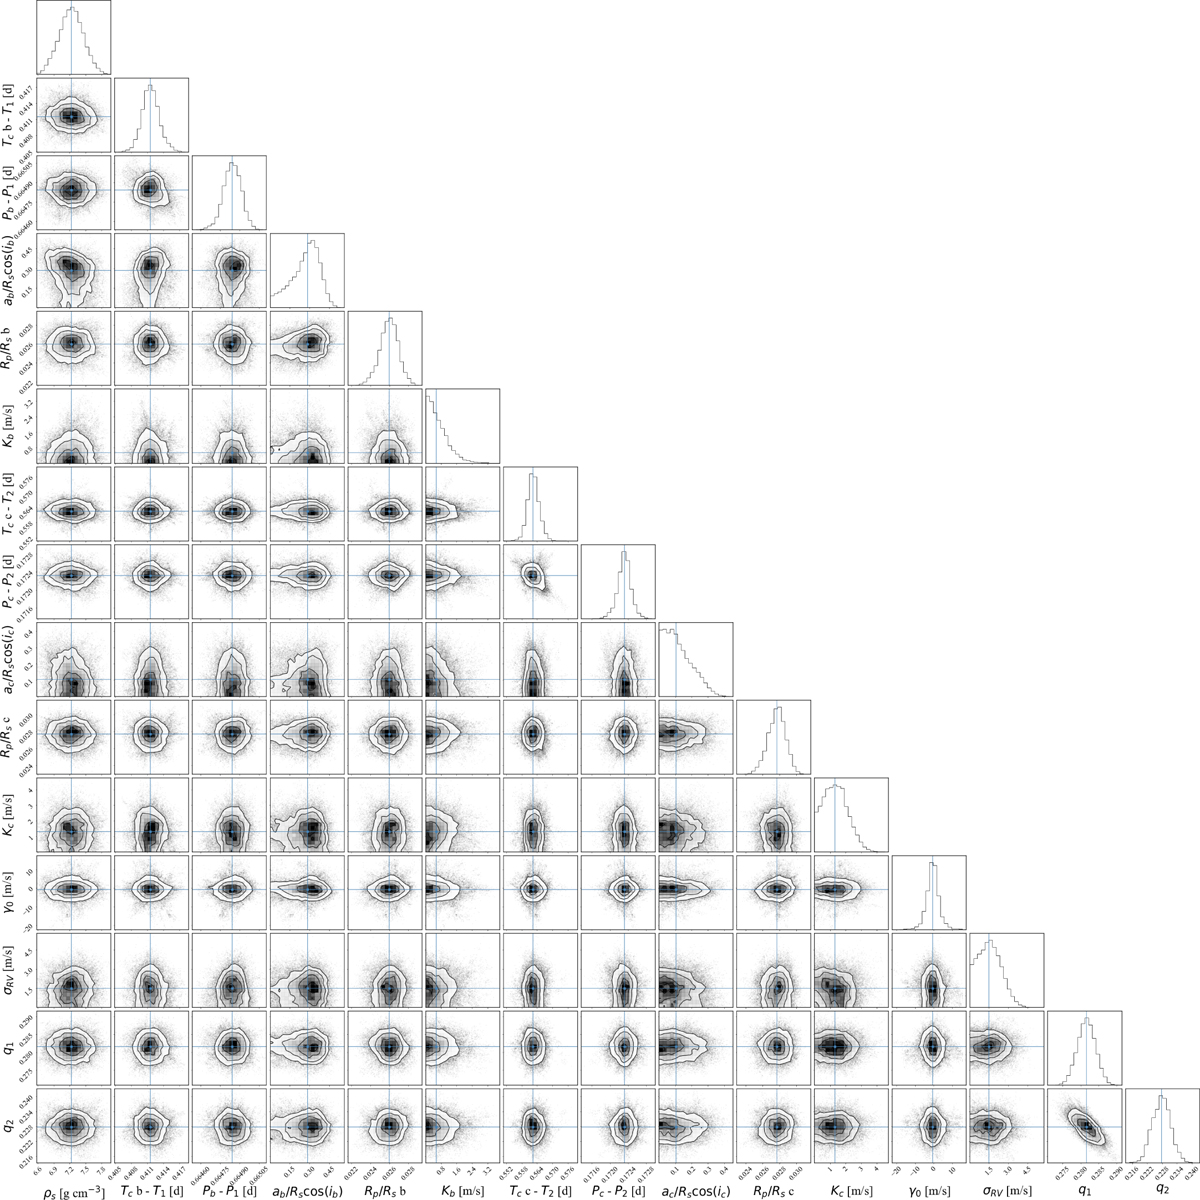
Fig. D.3
Download original image
Correlation plot for the fitted transit and orbital parameter. The free parameters used to model the systematic effects were intentionally left out for easy viewing. The blue lines marks the median values of the distribution. For plotting purposes the distributions for the central time of the transit and orbital period were offset by T1 = 2459240 days and P1 = 17 days for TOI-2095b and T2 = 2459239 days and P2 = 28 days for TOI-2095c, respectively.
Current usage metrics show cumulative count of Article Views (full-text article views including HTML views, PDF and ePub downloads, according to the available data) and Abstracts Views on Vision4Press platform.
Data correspond to usage on the plateform after 2015. The current usage metrics is available 48-96 hours after online publication and is updated daily on week days.
Initial download of the metrics may take a while.