Fig. 2
Download original image
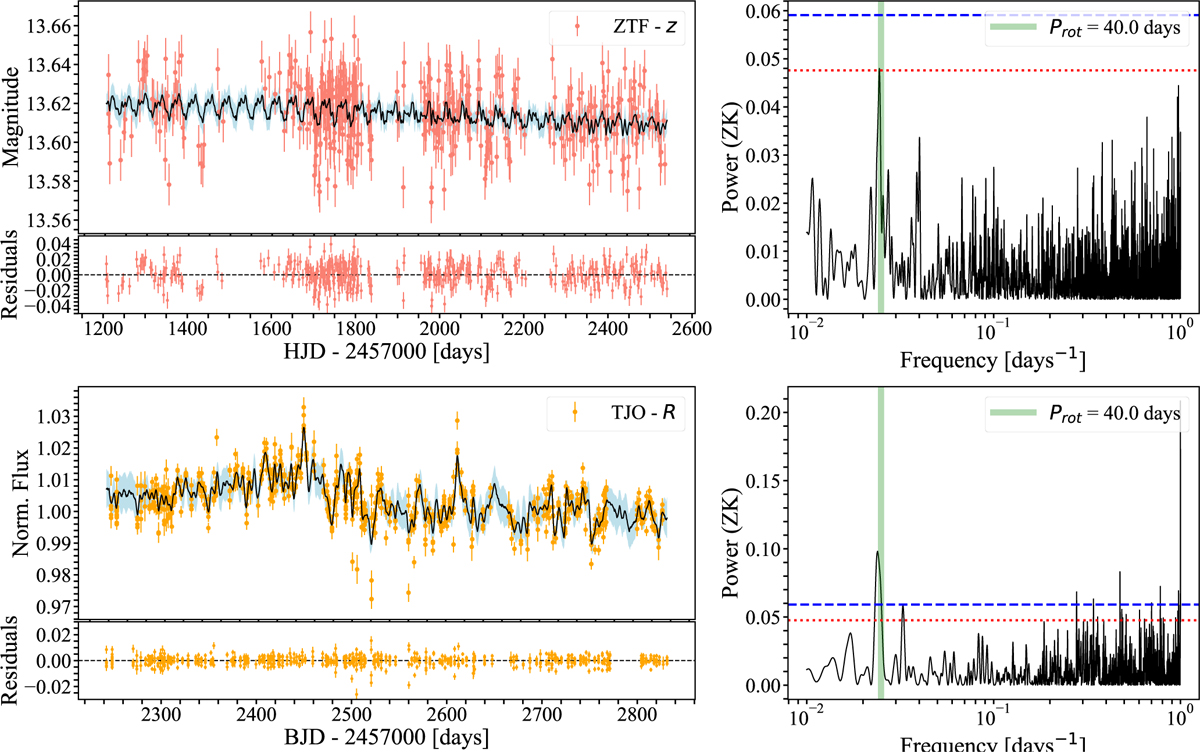
Long-term photometric follow-up of TOI-2095 from ZTF (z band) and TJO (R band). Left panels: photometric time-series and joint best fitted model computed using GP adopting a quasi-periodic kernel (black line). The 1σ uncertainty regions of the fit are shown in light blue. The residuals of the fit are shown at the bottom panels. Right panels: GLS periodogram (Zechmeister & Kürster 2009) for each photometric data set. The vertical green line shows the fitted rotational period of the star. The horizontal lines represent the FAP levels of 10% (red dotted line) and 1% (blue dashed line).
Current usage metrics show cumulative count of Article Views (full-text article views including HTML views, PDF and ePub downloads, according to the available data) and Abstracts Views on Vision4Press platform.
Data correspond to usage on the plateform after 2015. The current usage metrics is available 48-96 hours after online publication and is updated daily on week days.
Initial download of the metrics may take a while.