Open Access
Fig. D.1
Download original image
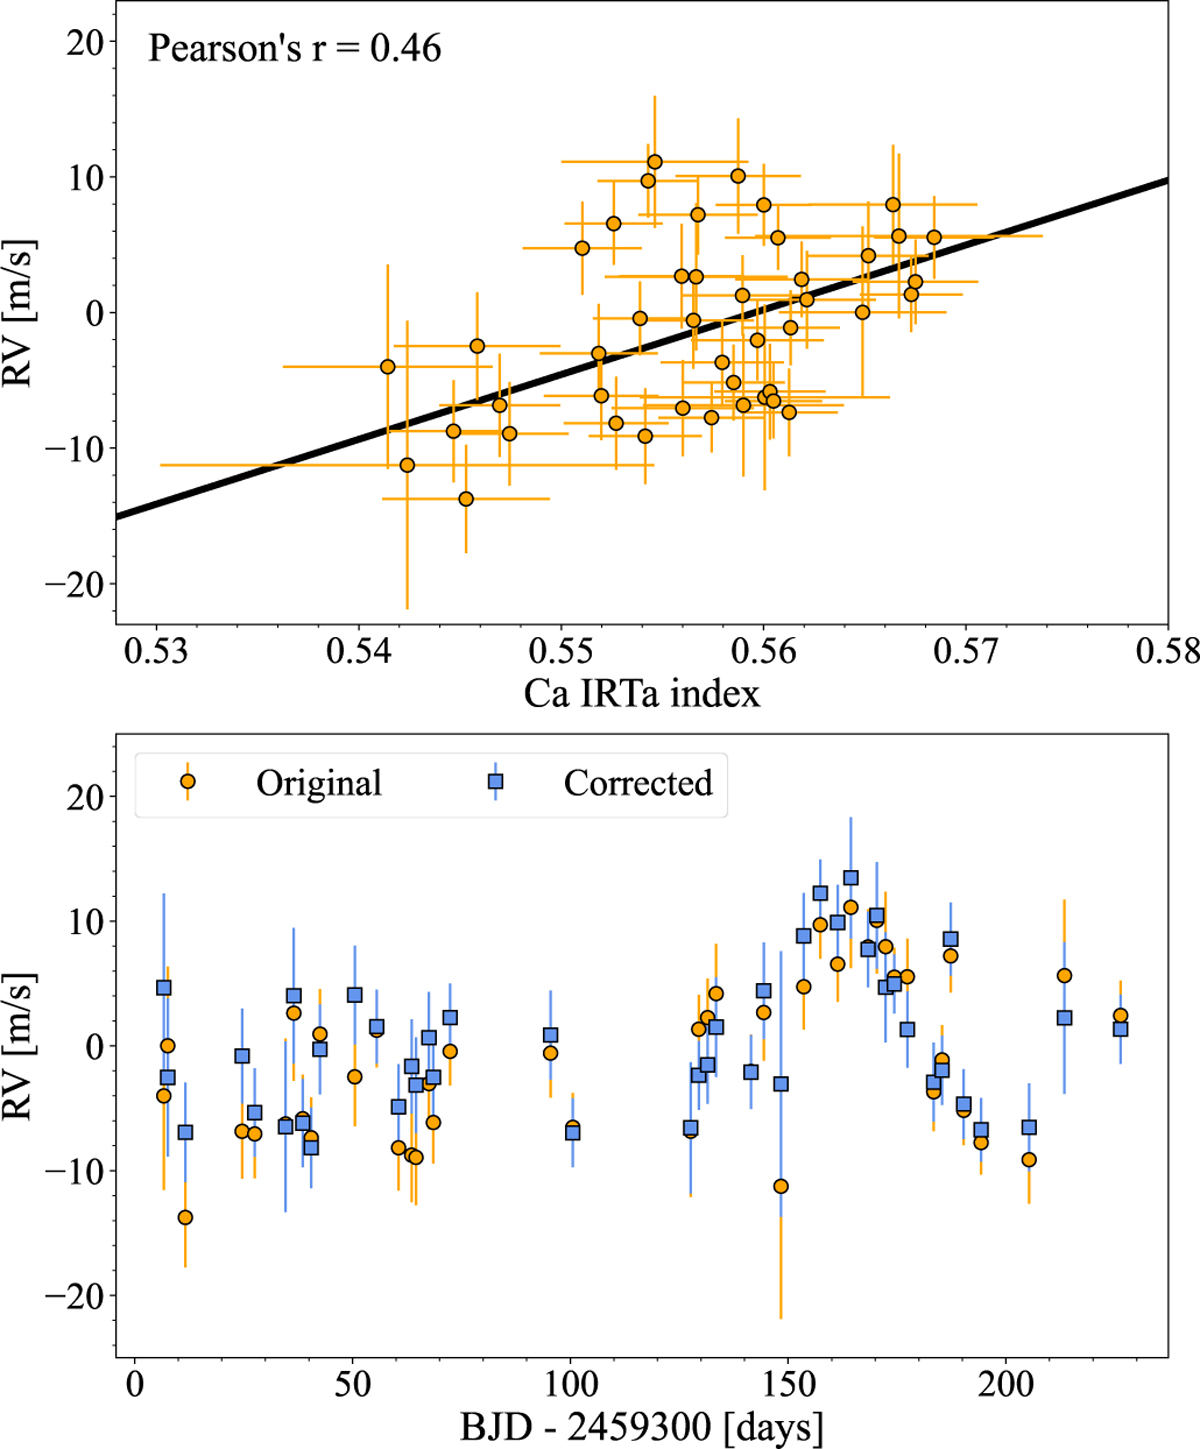
Radial velocity and Ca II stellar activity index correction. Top panel: RV measurements versus Ca IRTa activity index, the black line represents a linear fit to the data. Bottom panel: Uncorrected (orange circles) and activity-corrected (blue squares) RV measurements.
Current usage metrics show cumulative count of Article Views (full-text article views including HTML views, PDF and ePub downloads, according to the available data) and Abstracts Views on Vision4Press platform.
Data correspond to usage on the plateform after 2015. The current usage metrics is available 48-96 hours after online publication and is updated daily on week days.
Initial download of the metrics may take a while.