Fig. 13
Download original image
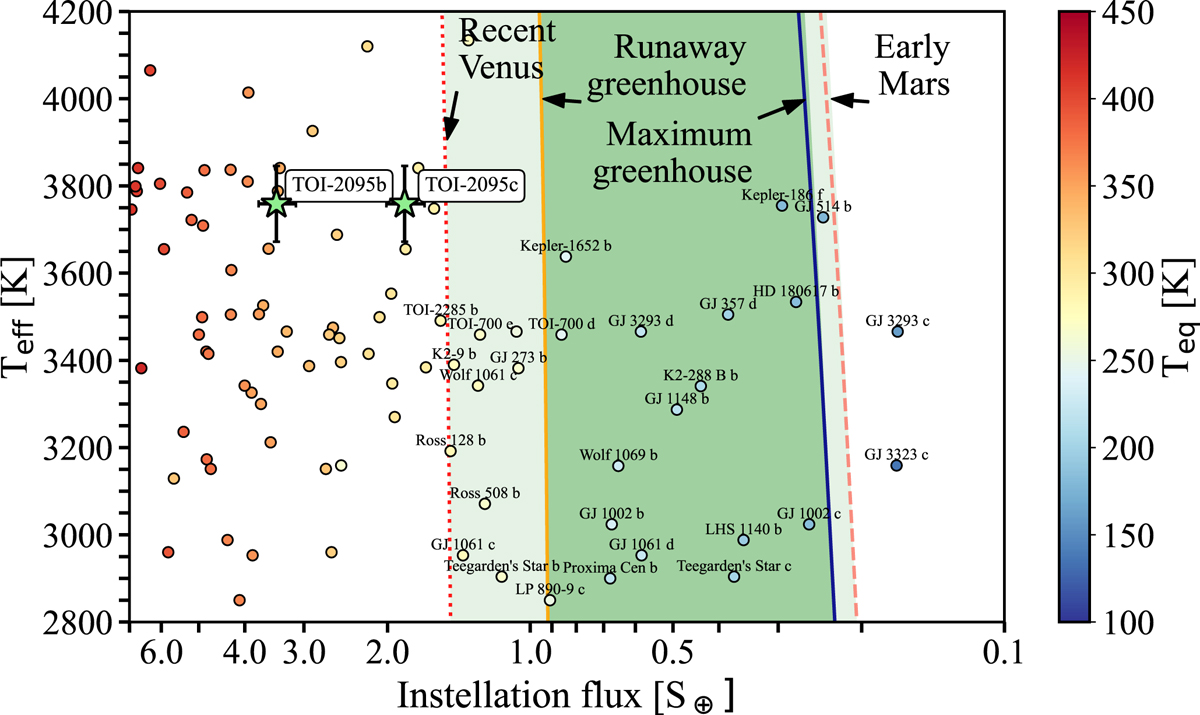
Incident flux in Earth units versus stellar effective temperature for known exoplanets (data taken from NASA Exoplanet Archive). The color of each circle represents the equilibrium temperature of the planet. The habitable zone limits of Kopparapu et al. (2013) are shown with lines. The position of TOI-2095b and TOI-2095c are marked by the green stars.
Current usage metrics show cumulative count of Article Views (full-text article views including HTML views, PDF and ePub downloads, according to the available data) and Abstracts Views on Vision4Press platform.
Data correspond to usage on the plateform after 2015. The current usage metrics is available 48-96 hours after online publication and is updated daily on week days.
Initial download of the metrics may take a while.