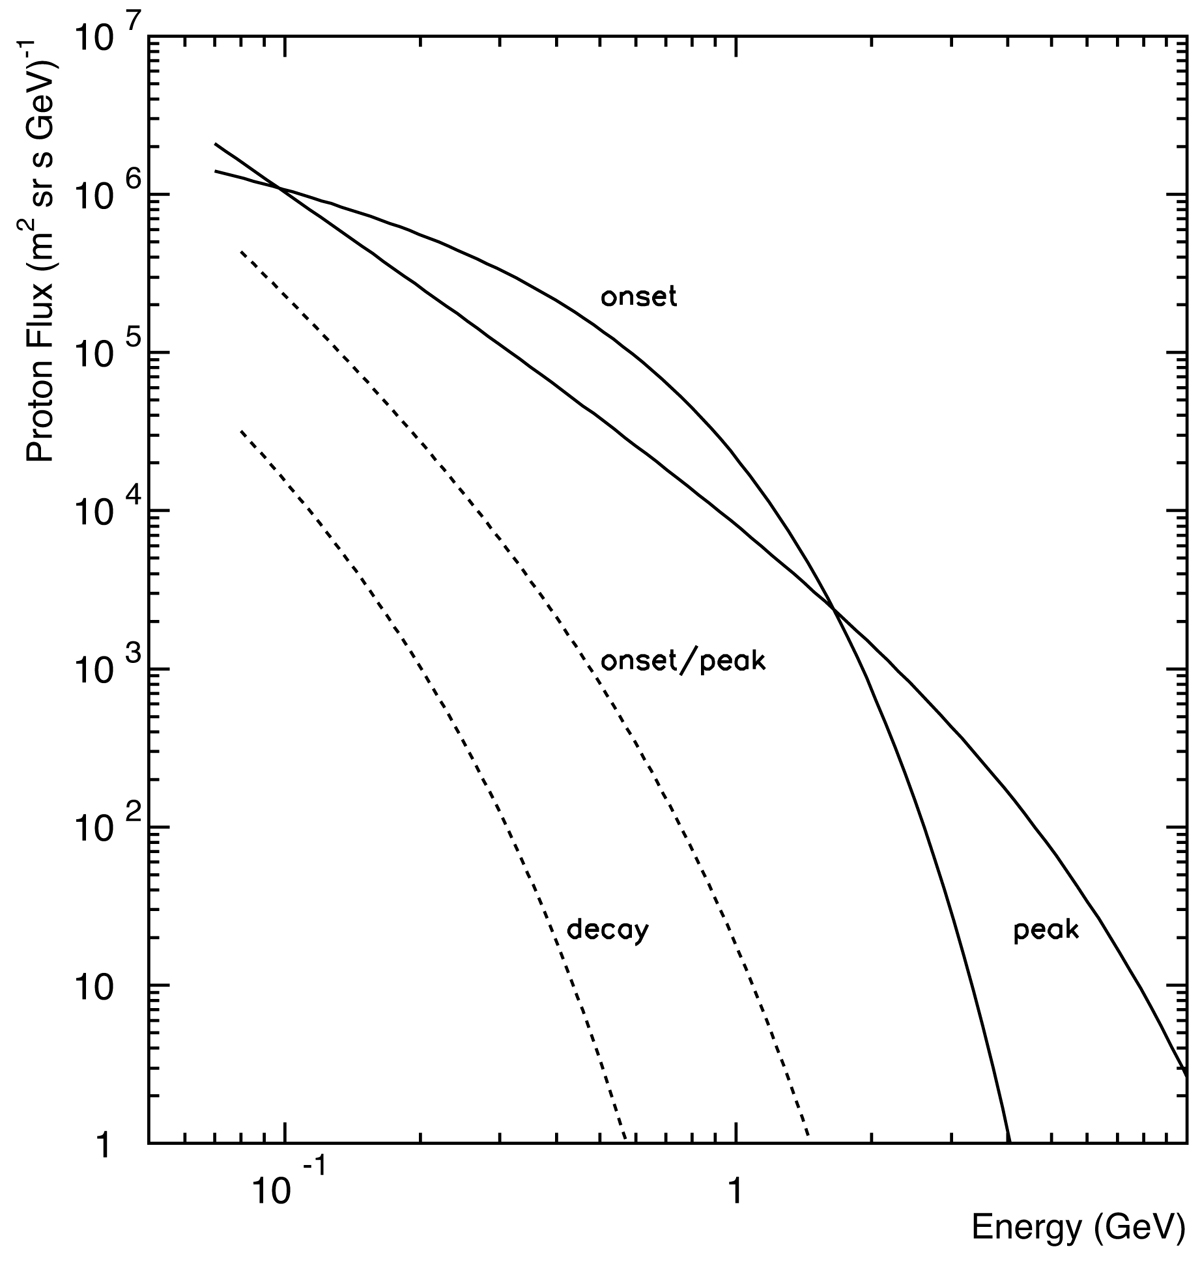
Fig. 3.
Download original image
Solar proton energy spectra measured by the PAMELA experiment during the evolution of the SEP events dated December 13 (solid lines) and December 14 (dashed lines), 2006. The different phases of the events are indicated in the figure.
Current usage metrics show cumulative count of Article Views (full-text article views including HTML views, PDF and ePub downloads, according to the available data) and Abstracts Views on Vision4Press platform.
Data correspond to usage on the plateform after 2015. The current usage metrics is available 48-96 hours after online publication and is updated daily on week days.
Initial download of the metrics may take a while.