Open Access
Fig. 9
Download original image
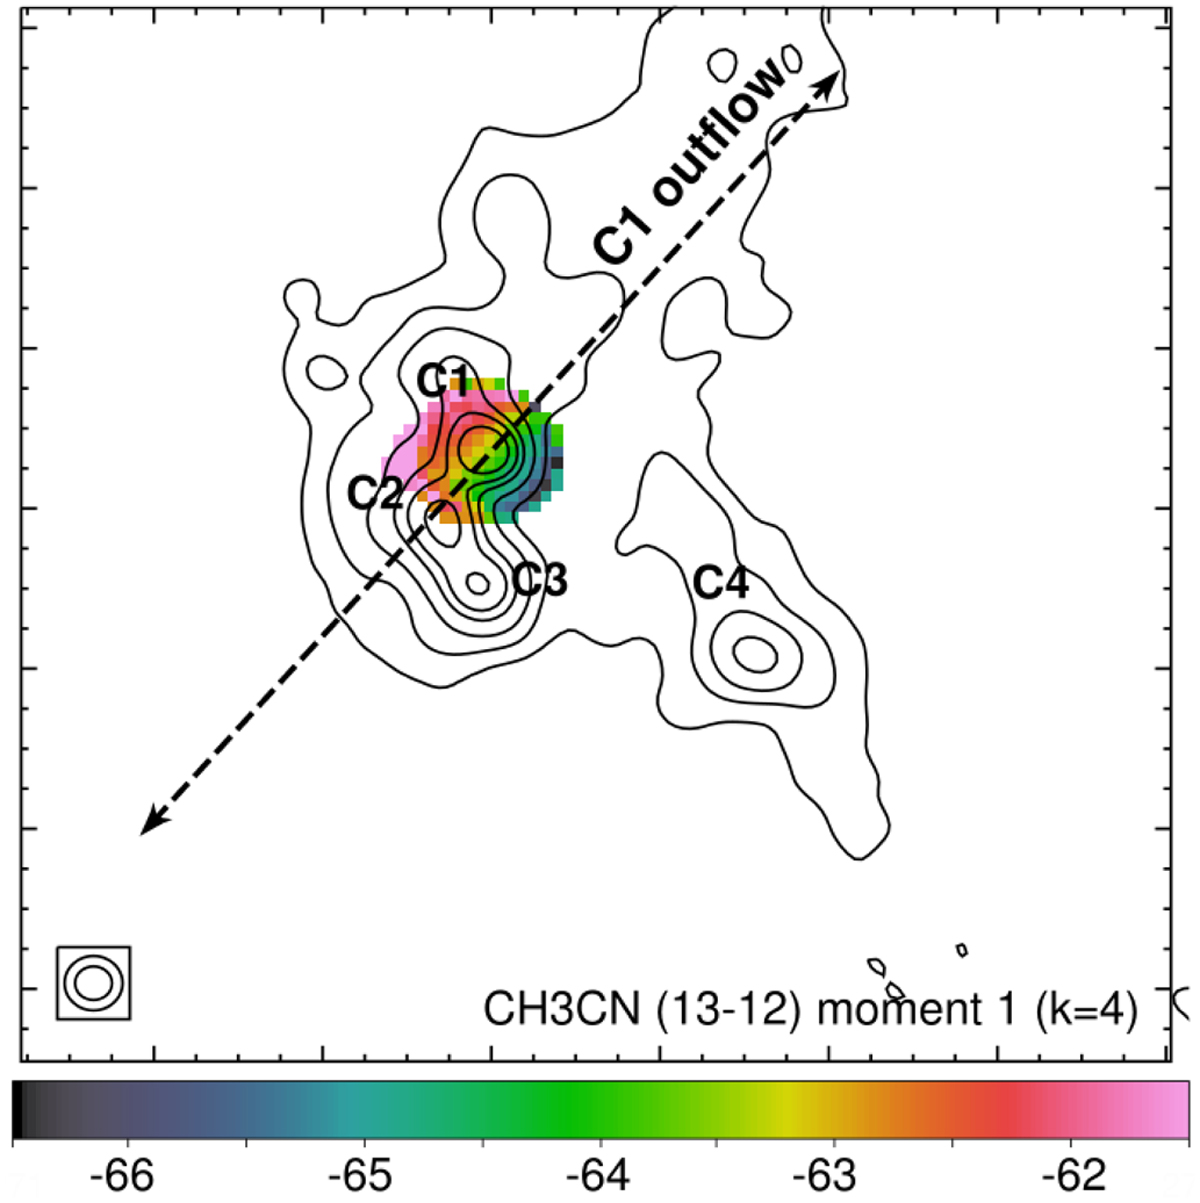
CH3CN J = 13–12 moment 1 map (from K = 4 projection). The black contours represent the continuum emission at 340 GHz with levels at 1, 10, 30, 60, 90, and 140 mJy beam−1. The dashed black line indicates the direction of the molecular outflow related to core C1. The beams are indicated in the bottom left corner.
Current usage metrics show cumulative count of Article Views (full-text article views including HTML views, PDF and ePub downloads, according to the available data) and Abstracts Views on Vision4Press platform.
Data correspond to usage on the plateform after 2015. The current usage metrics is available 48-96 hours after online publication and is updated daily on week days.
Initial download of the metrics may take a while.