Fig. 6
Download original image
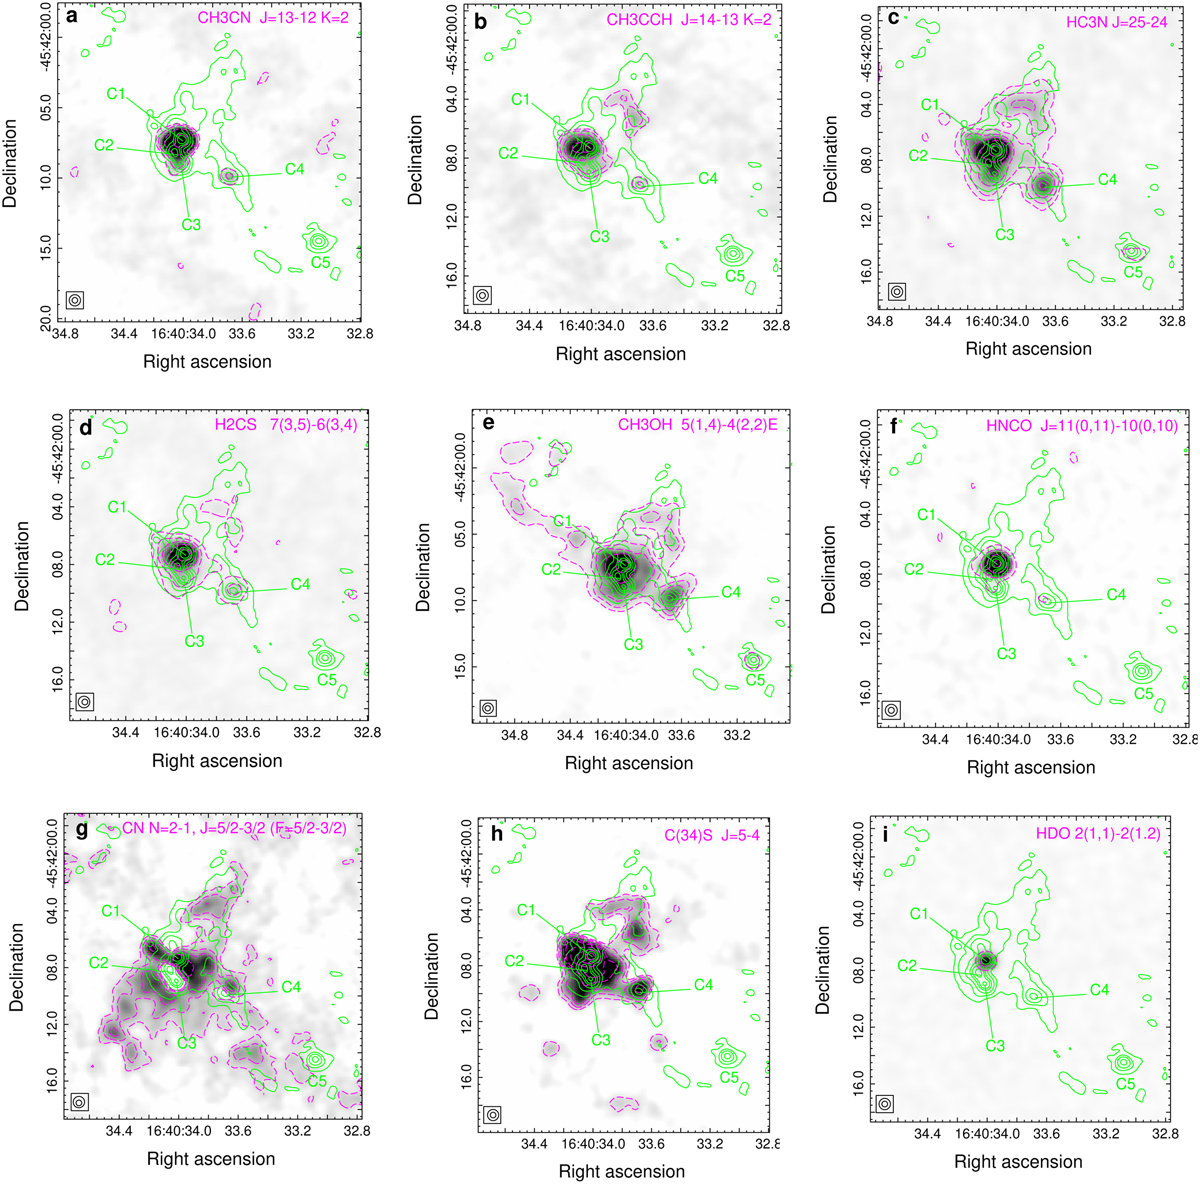
Integrated emission maps (moment 0) of the selected molecular lines (indicated in each panel and in Table 4). Dashed magenta contours represent the molecular line emission at the following levels (in Jy beam−1 km s−1): 0.1, 0.3, 1, and 4 (CH3CN), 0.05, 0.10, 0.20, 0.50, and 0.65 (CH3CCH), 0.04, 0.1, 0.25, 0.6, 1.3, and 3 (HC3N), 0.05, 0.2, 0.5, 1.2, and 3 (H2CS), 0.1, 0.3, 0.6, 1.5, and 5 (CH3OH), 0.05, 0.2, 1, and 3 (HNCO), 0.02, 0.04, 0.08, and 0.16 (CN), 0.07, 0.12, 0.2, 0.4, 0.6, 1.2, 2, and 3 (C34S), and 0.5, 1, and 2 (HDO). The integration velocity interval ranges from −67 to −61 km s−1 for all molecular lines, except for H2CS and CH3OH (−67 to −62 km s−1) and for HNCO (−67 to −63 km s−1). The green contours represent the continuum emission at 340 GHz with levels at 1, 10, 30, 60, 90, and 140 mJy beam−1. The beams of 340 GHz continuum and line emissions are indicated in the bottom left corner.
Current usage metrics show cumulative count of Article Views (full-text article views including HTML views, PDF and ePub downloads, according to the available data) and Abstracts Views on Vision4Press platform.
Data correspond to usage on the plateform after 2015. The current usage metrics is available 48-96 hours after online publication and is updated daily on week days.
Initial download of the metrics may take a while.