Fig. 5
Download original image
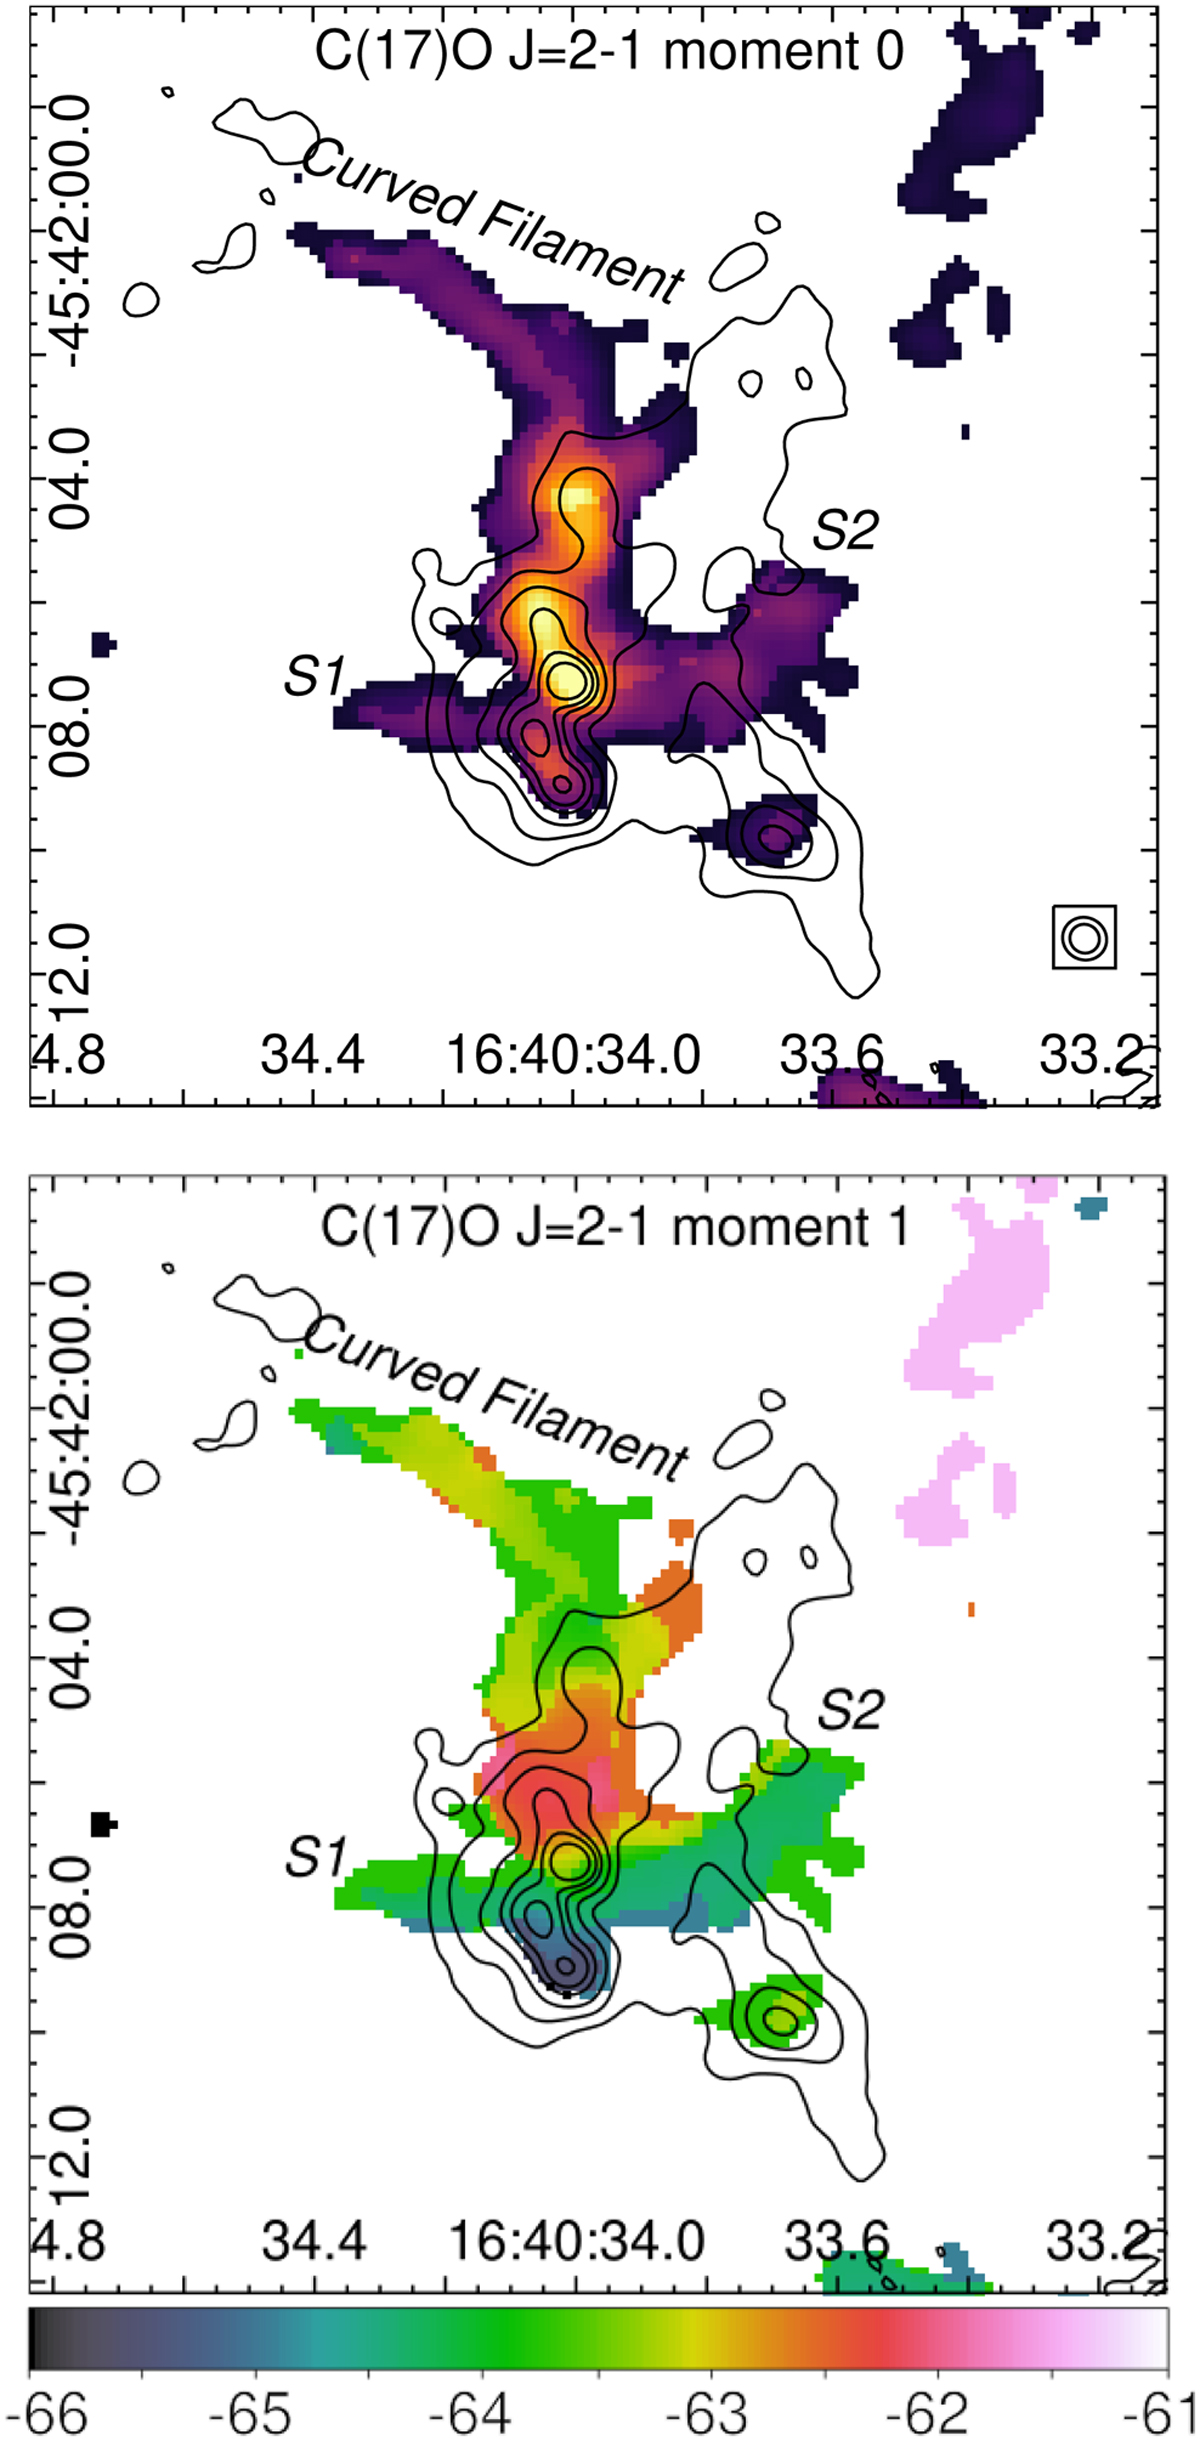
C17O J = 2−1 moment maps. Top panel: C17O J = 2−1 moment 0 map integrated between −66 and −61 km s−1. The colour scale goes from 0.01 to 0.50 Jy beam−1. The black contours represent the continuum emission at 340 GHz with levels at 1, 10, 30, 60, 90, and 140 mJy beam−1. The beams of the C17O J = 2−1 line and the 340 GHz continuum emission are indicated in the bottom right corner. Bottom panel: C17O J = 2−1 moment 1 map. The units of the colour bar are km s−1. The black contours represent the radio continuum at 340 GHz with levels at 1, 10, 30, 60, 90, and 140 mJy beam−1. The systemic velocity is about −64 km s−1.
Current usage metrics show cumulative count of Article Views (full-text article views including HTML views, PDF and ePub downloads, according to the available data) and Abstracts Views on Vision4Press platform.
Data correspond to usage on the plateform after 2015. The current usage metrics is available 48-96 hours after online publication and is updated daily on week days.
Initial download of the metrics may take a while.