Fig. 2
Download original image
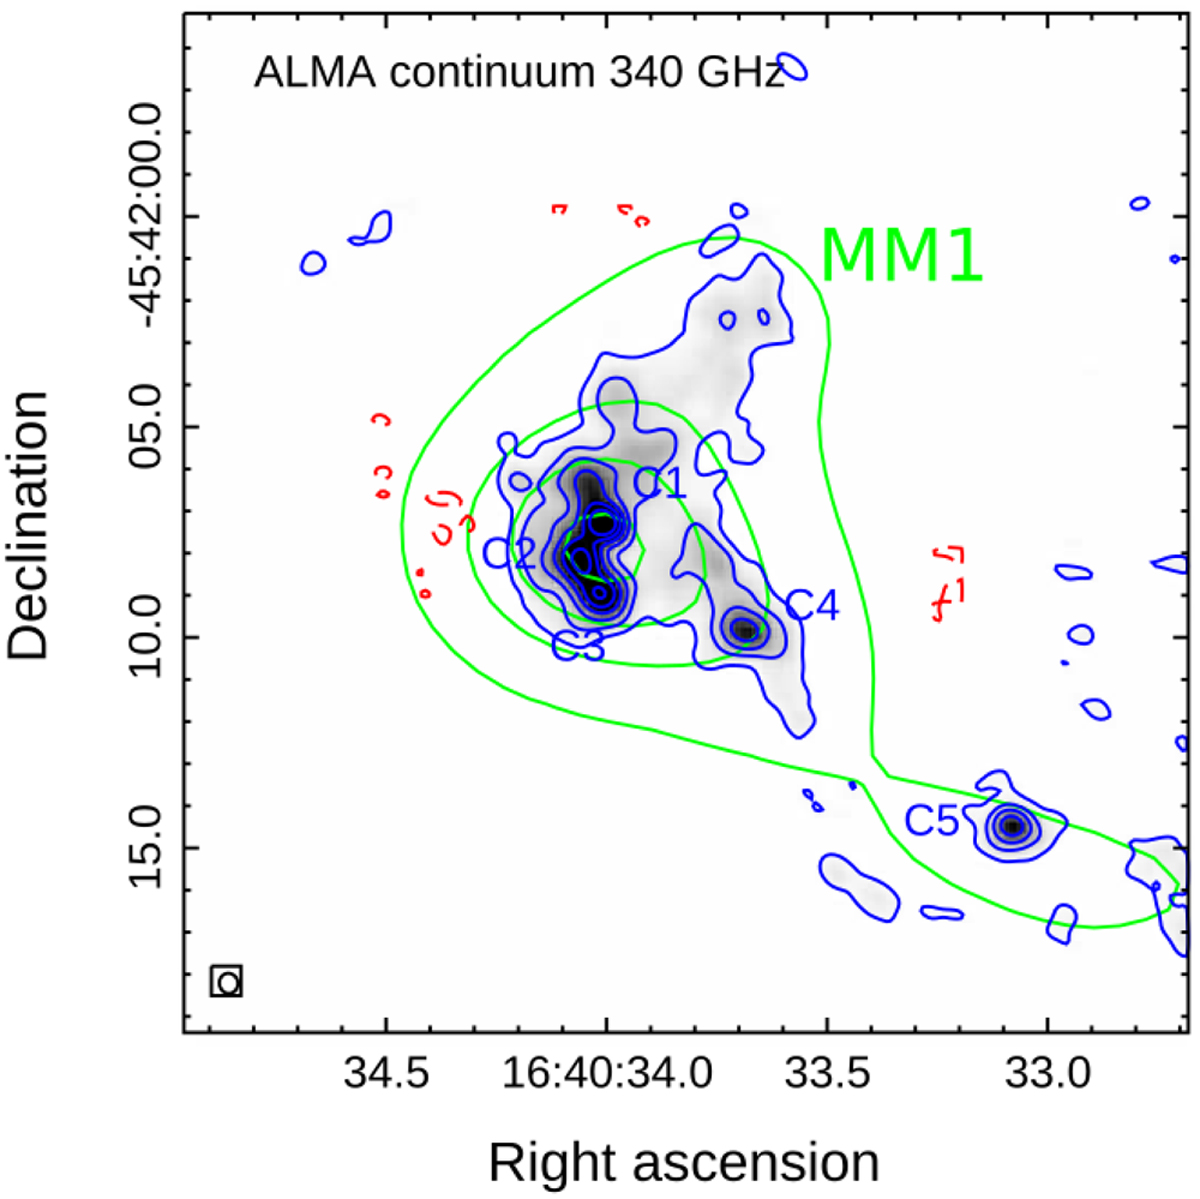
ALMA continuum emission at 340 GHz (12 m array). The greyscale goes from 1 to 180 mJy beam−1. The blue contour levels are: 1 (about 5 σ), 10, 30, 60, 90, and 140 mJy beam−1. The dashed red contours correspond to −1 mJy beam−1. The beam of 340 GHz continuum emission (12 m array) is indicated in the bottom left corner. The green contours correspond to the ALMA continuum emission at 340 GHz (7 m array) shown in Fig. 1, with levels at 0.2, 0.4, 0.7, and 1.4 Jy beam−1.
Current usage metrics show cumulative count of Article Views (full-text article views including HTML views, PDF and ePub downloads, according to the available data) and Abstracts Views on Vision4Press platform.
Data correspond to usage on the plateform after 2015. The current usage metrics is available 48-96 hours after online publication and is updated daily on week days.
Initial download of the metrics may take a while.