Fig. 10
Download original image
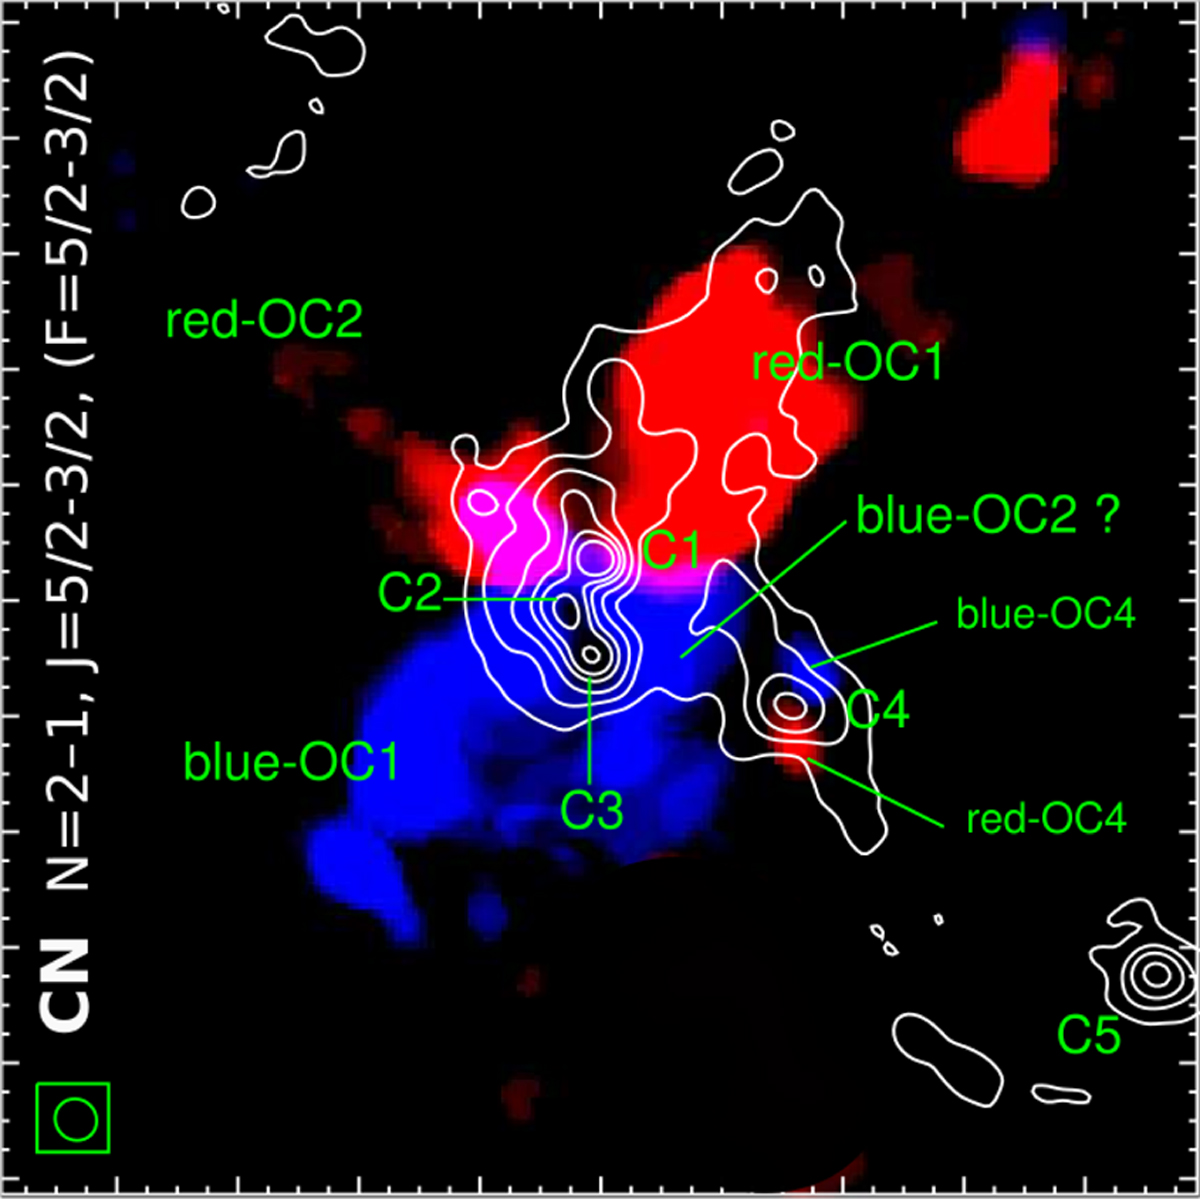
CN N = 2–1, J = 5/2−3/2 (F = 5/2−3/2) emission distri- bution integrated between −80 and −70 kms−1 (blue) and between −55 and −40 km s−1 (red). The systemic velocity of the complex is about −64 kms−1. The white contours represent the radio continuum at 340 GHz (12 m array). Levels are at 1, 10, 30, 60, 90, and 140 mJy beam−1 . The beam of the line emission is indicated in the bottom left corner.
Current usage metrics show cumulative count of Article Views (full-text article views including HTML views, PDF and ePub downloads, according to the available data) and Abstracts Views on Vision4Press platform.
Data correspond to usage on the plateform after 2015. The current usage metrics is available 48-96 hours after online publication and is updated daily on week days.
Initial download of the metrics may take a while.