Fig. 1
Download original image
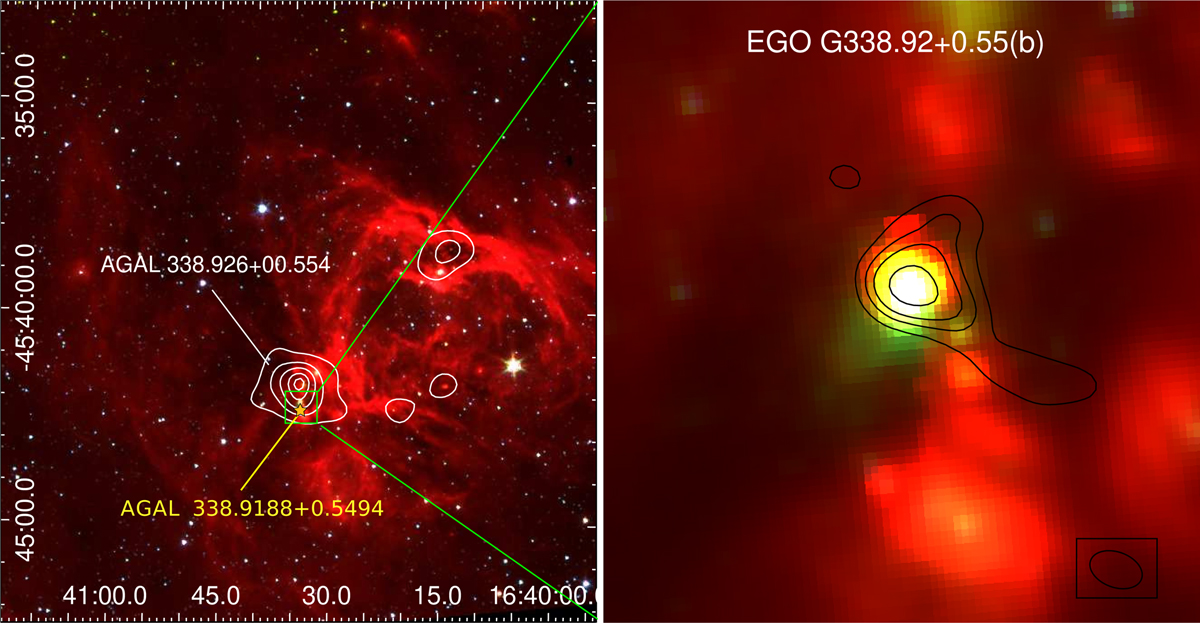
Large-scale surroundings of EGO G338.92+0.55(b). Left-panel: Overview of the H II region G338.90+00.60 at Spitzer 3.6 (blue), 4.5 (green), and 8.0 (red) µm bands. The white contours represent the continuum emission at 870 µm extracted from the ATLASGAL survey. Levels are: 1, 3, 6, 9, and 12 Jy beam−1. The green square highlights the region studied in this work, which includes the position of EGO G338.92+0.55(b) represented by the yellow star. Right-panel: A close-up view of the EGO at the same Spitzer bands. The black contours represent the ALMA continuum emission at 340 GHz (7 m array). Levels are: 0.2, 0.4, 0.7, and 1.4 Jy beam−1. The beam of the ALMA observation is indicated in the bottom-right corner. The blue, green, and red colour scales go from 10 to 500 MJy sr−1.
Current usage metrics show cumulative count of Article Views (full-text article views including HTML views, PDF and ePub downloads, according to the available data) and Abstracts Views on Vision4Press platform.
Data correspond to usage on the plateform after 2015. The current usage metrics is available 48-96 hours after online publication and is updated daily on week days.
Initial download of the metrics may take a while.