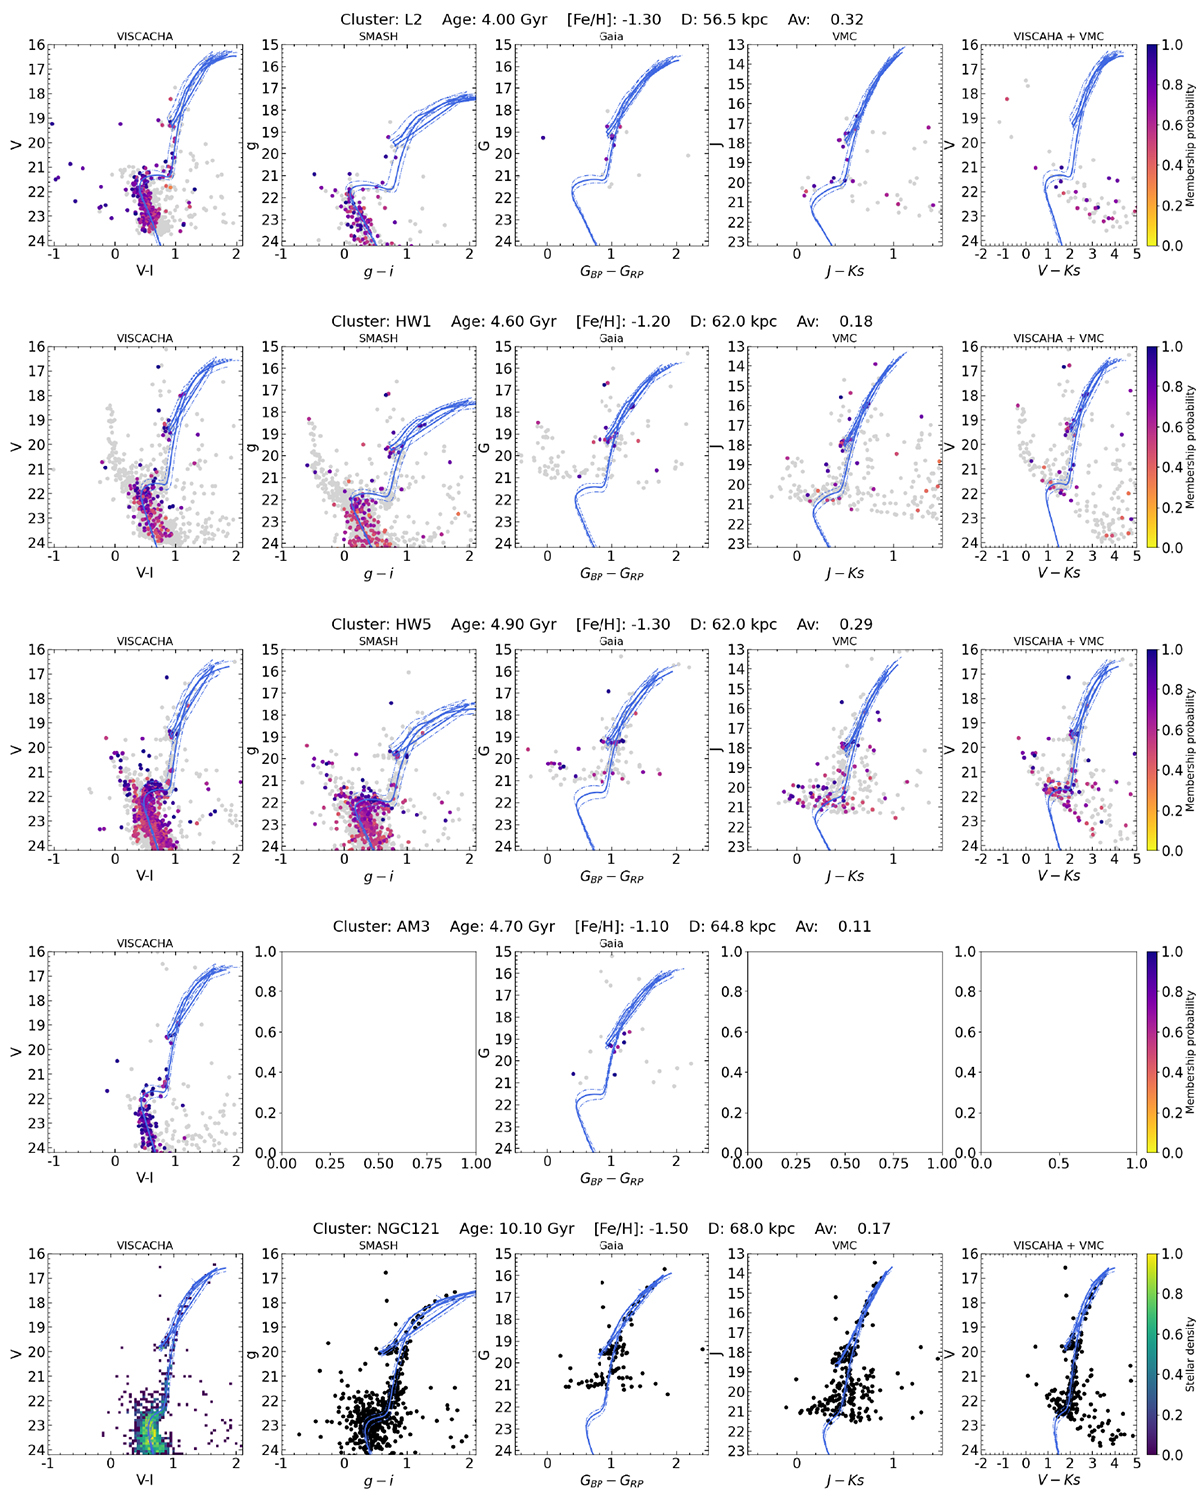
Fig. A.3.
Download original image
Same as Fig. A.1 but for more clusters. The bottom panels represent NGC 121 and have a different colour code (explanation is given in Section 4). The colours represent the normalised stellar number density of the stars in the CMD and clearly show that the isochrone is tracing well-defined CMD features. As the density of stars is lower in other surveys, the colour code was not adopted for them.
Current usage metrics show cumulative count of Article Views (full-text article views including HTML views, PDF and ePub downloads, according to the available data) and Abstracts Views on Vision4Press platform.
Data correspond to usage on the plateform after 2015. The current usage metrics is available 48-96 hours after online publication and is updated daily on week days.
Initial download of the metrics may take a while.