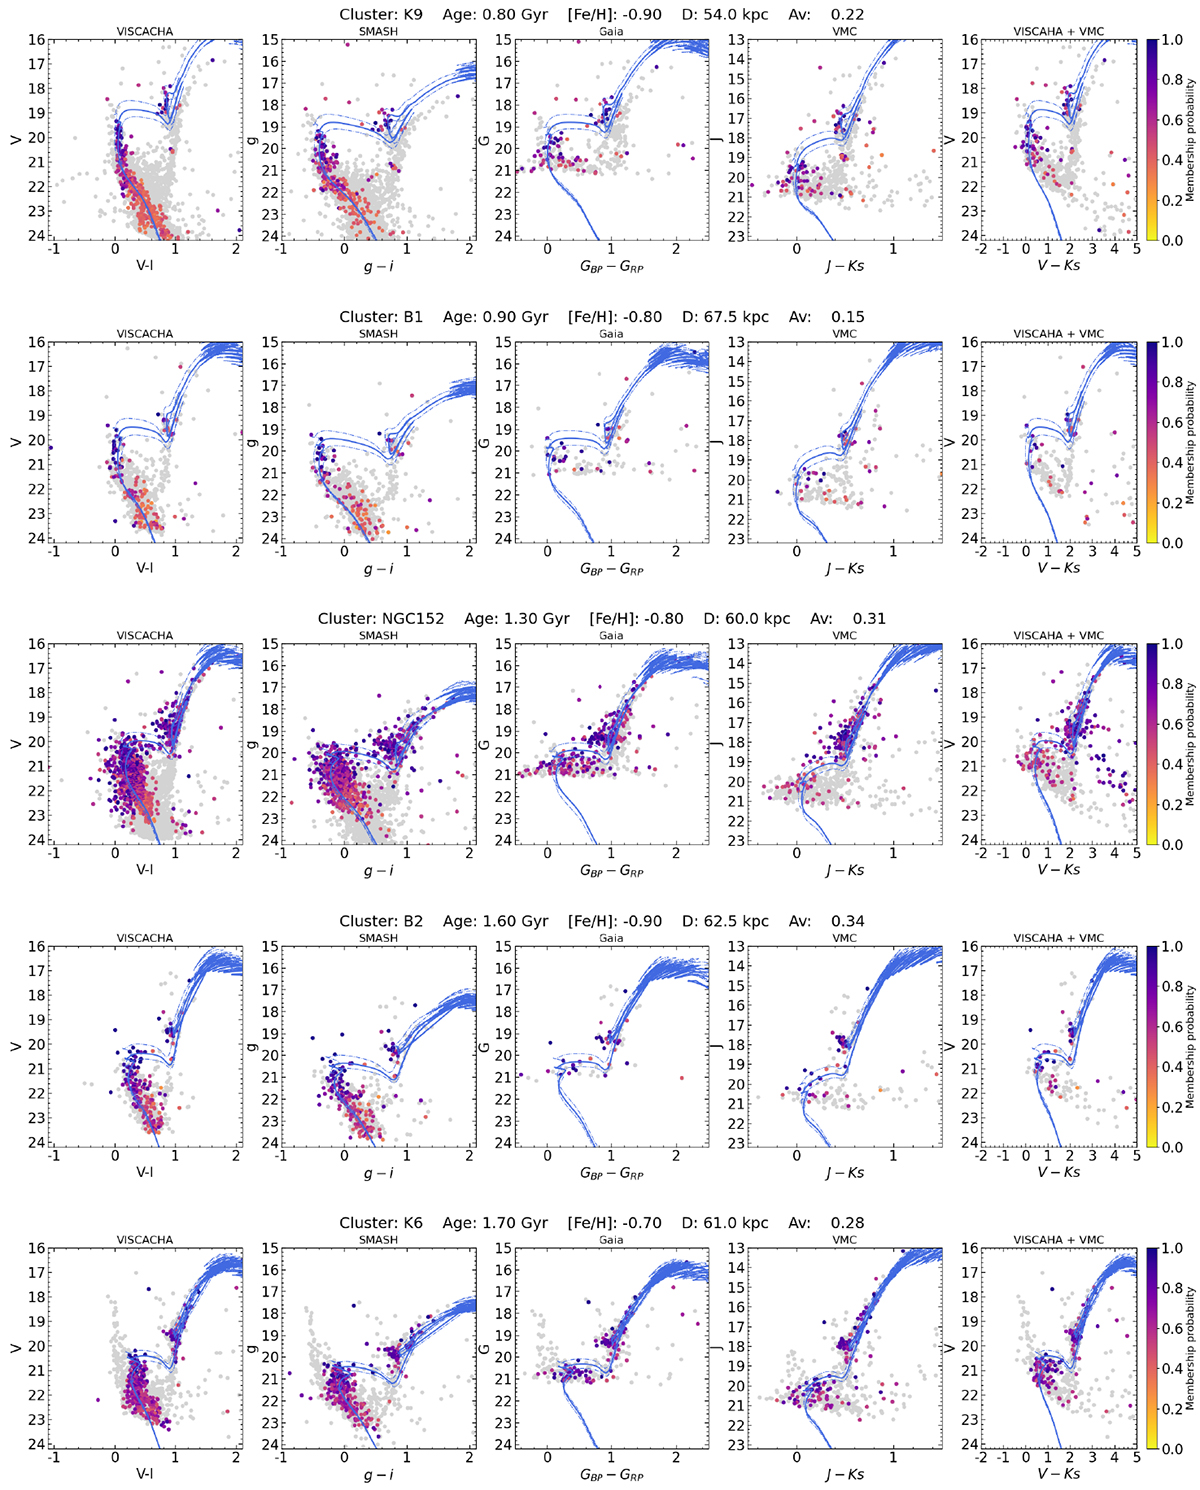
Fig. A.1.
Download original image
Best fitting isochrones for the decontaminated CMDs (similar to the ones shown in Figure 2) of several sample clusters. The CMDs for each cluster from different surveys, including SMASH, Gaia, and VMC, are plotted in their respective filters and labelled accordingly. The membership probability derived for the VISCACHA sample was adopted for the matched stars in other catalogues as well. The solid line represents the best fitting isochrone, while the dash-dotted isochrones indicate the boundaries that determine the uncertainties of the derived parameters.
Current usage metrics show cumulative count of Article Views (full-text article views including HTML views, PDF and ePub downloads, according to the available data) and Abstracts Views on Vision4Press platform.
Data correspond to usage on the plateform after 2015. The current usage metrics is available 48-96 hours after online publication and is updated daily on week days.
Initial download of the metrics may take a while.