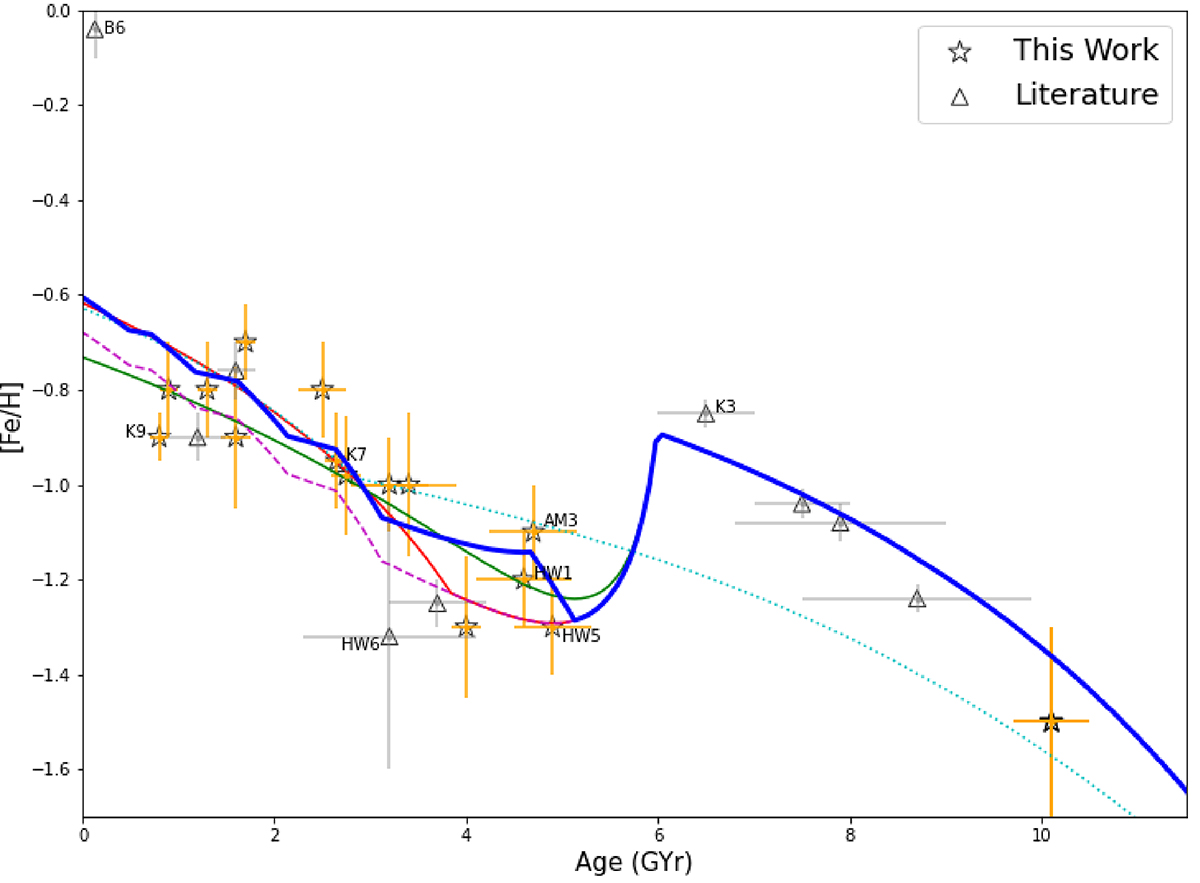
Fig. 5.
Download original image
Points and green and red curves same as in Fig. 4. The cyan dotted curve shows the case with no merger and a burst of star formation 3 Gyr ago. The magenta dashed curve represents the scenario with multiple bursts at 3 Gyr, 2 Gyr, 1.1 Gyr, and 0.45 Gyr with a duration of 0.5 Gyr each (Massana et al. 2022). The blue solid curve illustrates the aforementioned scenario of multiple bursts with an additional burst 5 Gyr ago (Rubele et al. 2015).
Current usage metrics show cumulative count of Article Views (full-text article views including HTML views, PDF and ePub downloads, according to the available data) and Abstracts Views on Vision4Press platform.
Data correspond to usage on the plateform after 2015. The current usage metrics is available 48-96 hours after online publication and is updated daily on week days.
Initial download of the metrics may take a while.