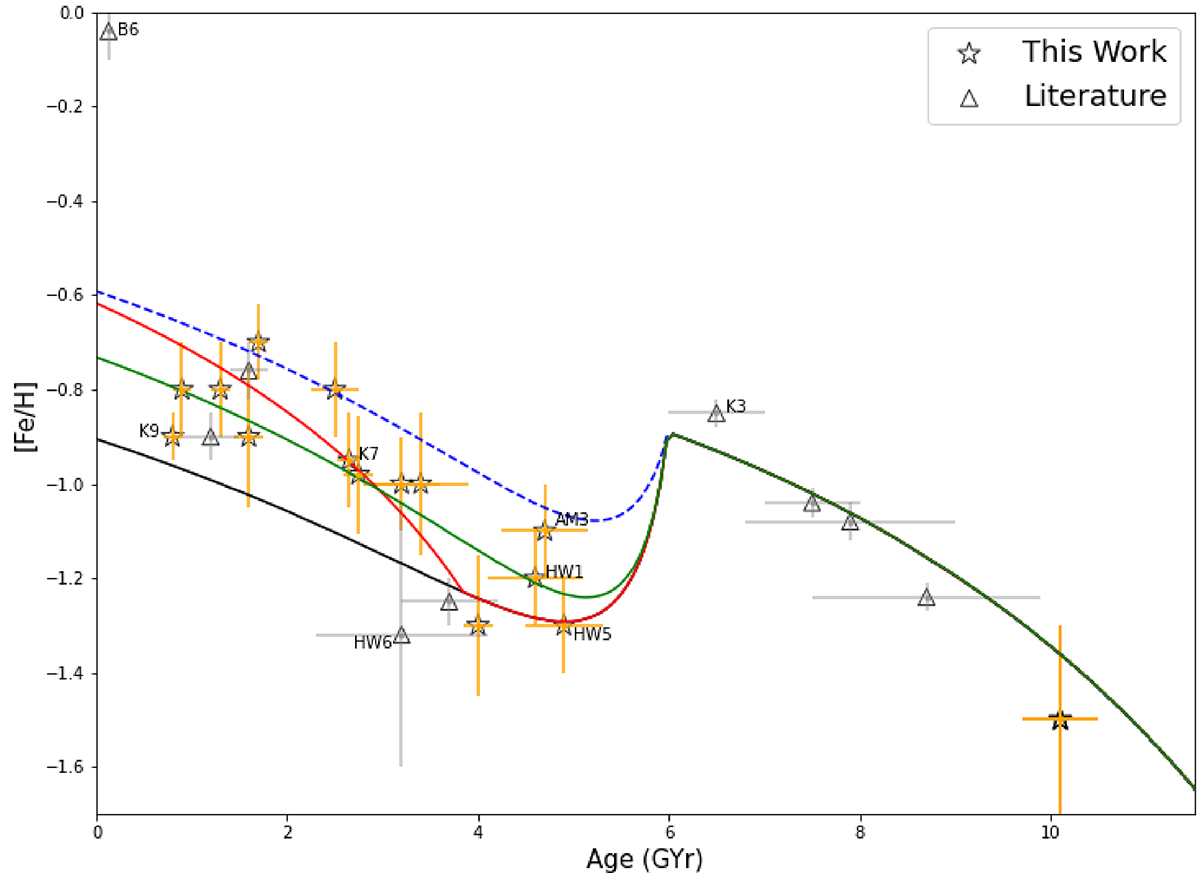
Fig. 4.

Download original image
Age–metallicity relation for SMC WH star clusters. Stars denote the results from this work, and triangles indicate the results from the extended sample from the literature (see text and Tables 1 and A.2 for more details). The extended curves represent the results of the model in which the merger has mass ratios of 1:4 (black solid curve) and 1:2 (blue dashed curve). The green solid curve represents the merger model with a 1:4 mass ratio that took place 6 Gyr ago and caused an enhanced SFR, whereas the red solid curve is the scenario with an enhanced SFR 2 Gyr later.
Current usage metrics show cumulative count of Article Views (full-text article views including HTML views, PDF and ePub downloads, according to the available data) and Abstracts Views on Vision4Press platform.
Data correspond to usage on the plateform after 2015. The current usage metrics is available 48-96 hours after online publication and is updated daily on week days.
Initial download of the metrics may take a while.


