Open Access
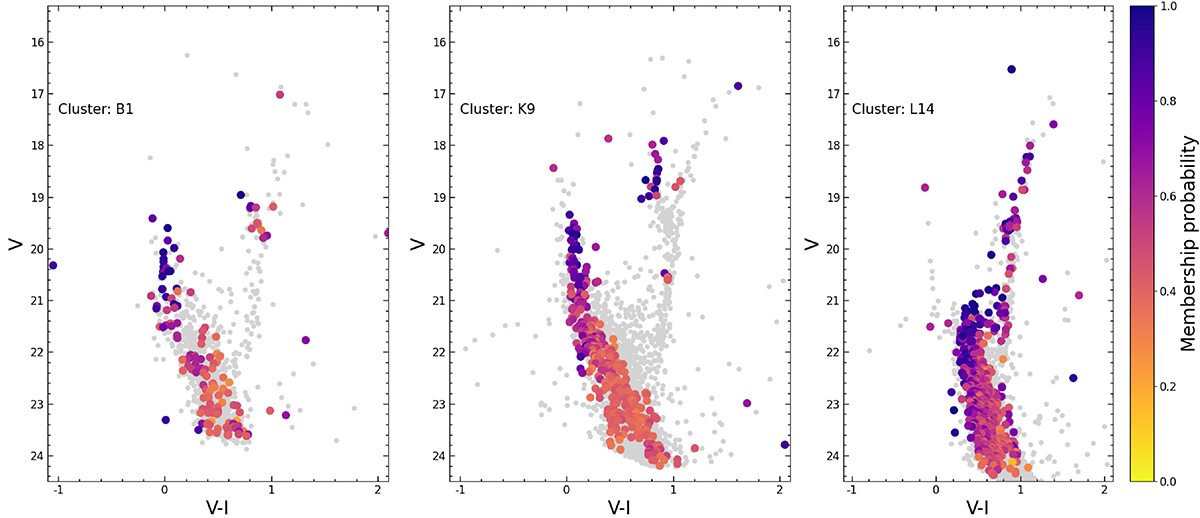
Fig. 2.
Download original image
Decontaminated CMDs for three example clusters from our sample. The coloured points are the stars belonging to the cluster population. The grey points represent the field stars. The colours represents the membership probability of the cluster population.
Current usage metrics show cumulative count of Article Views (full-text article views including HTML views, PDF and ePub downloads, according to the available data) and Abstracts Views on Vision4Press platform.
Data correspond to usage on the plateform after 2015. The current usage metrics is available 48-96 hours after online publication and is updated daily on week days.
Initial download of the metrics may take a while.