Fig. 4
Download original image
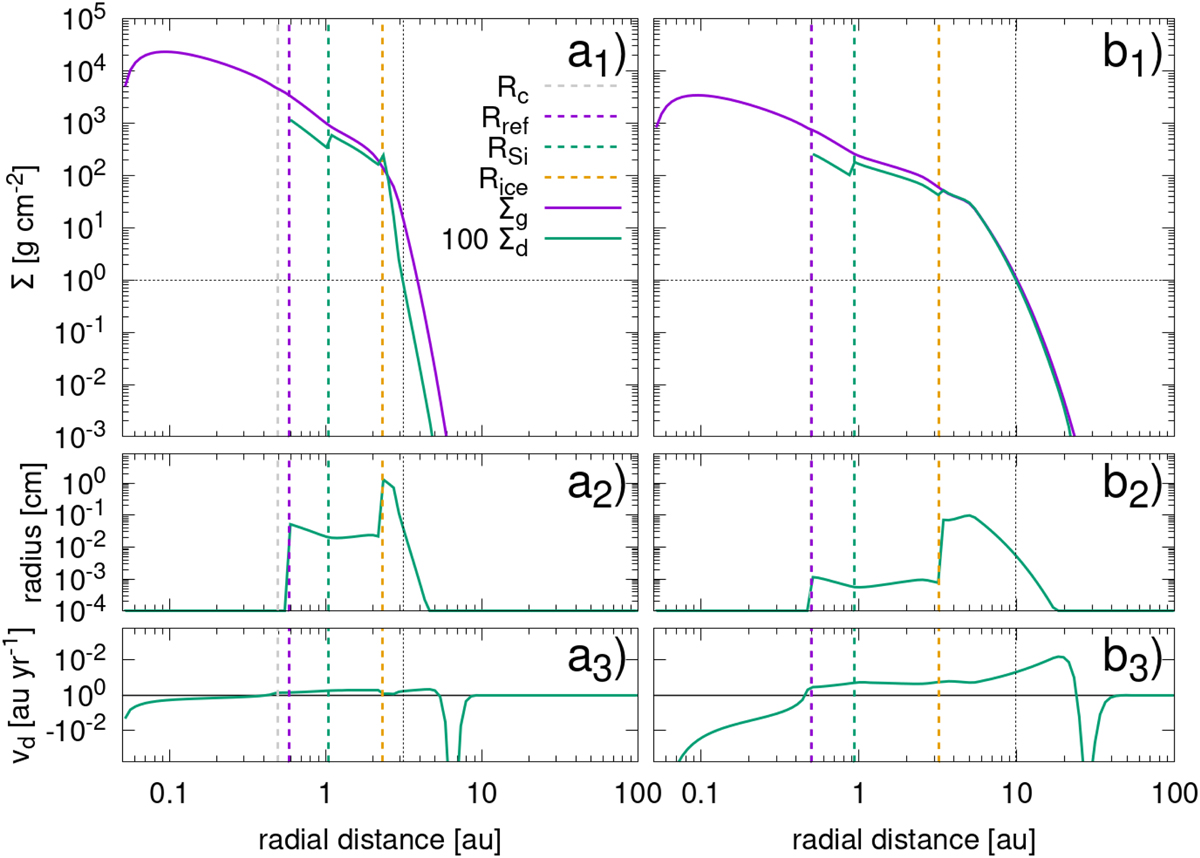
Disk properties for two cases with Tinfall = 100 kyr but different initial viscosities: α0 = 0.01 (a) and α0 = 0.1 (b). Both cases are shown at 1000 yr after disk formation. The top panels (a1 and b1) show the gas surface density (solid purple) and 100 times the dust surface density (solid green) as a function of distance to the star. The vertical dash lines show the centrifugal radius, RC (grey), the condensation lines of refractories (purple) and silicates (green), and the sublimation line of water (yellow). The fine vertical black line shows the distance where the dust surface density has a value of 10−2 g cm−2. The middle panels (a2 and b2) show the dust size, and the bottom panels (a3 and b3) the radial dust speed. A positive radial velocity represents motion away from the star, while a negative velocity is towards the star. Both of the shown simulations assume the nominal fragmentation thresholds of 1 m s−1 and 10 m s−1 for dry and icy particles, respectively.
Current usage metrics show cumulative count of Article Views (full-text article views including HTML views, PDF and ePub downloads, according to the available data) and Abstracts Views on Vision4Press platform.
Data correspond to usage on the plateform after 2015. The current usage metrics is available 48-96 hours after online publication and is updated daily on week days.
Initial download of the metrics may take a while.