Fig. 7
Download original image
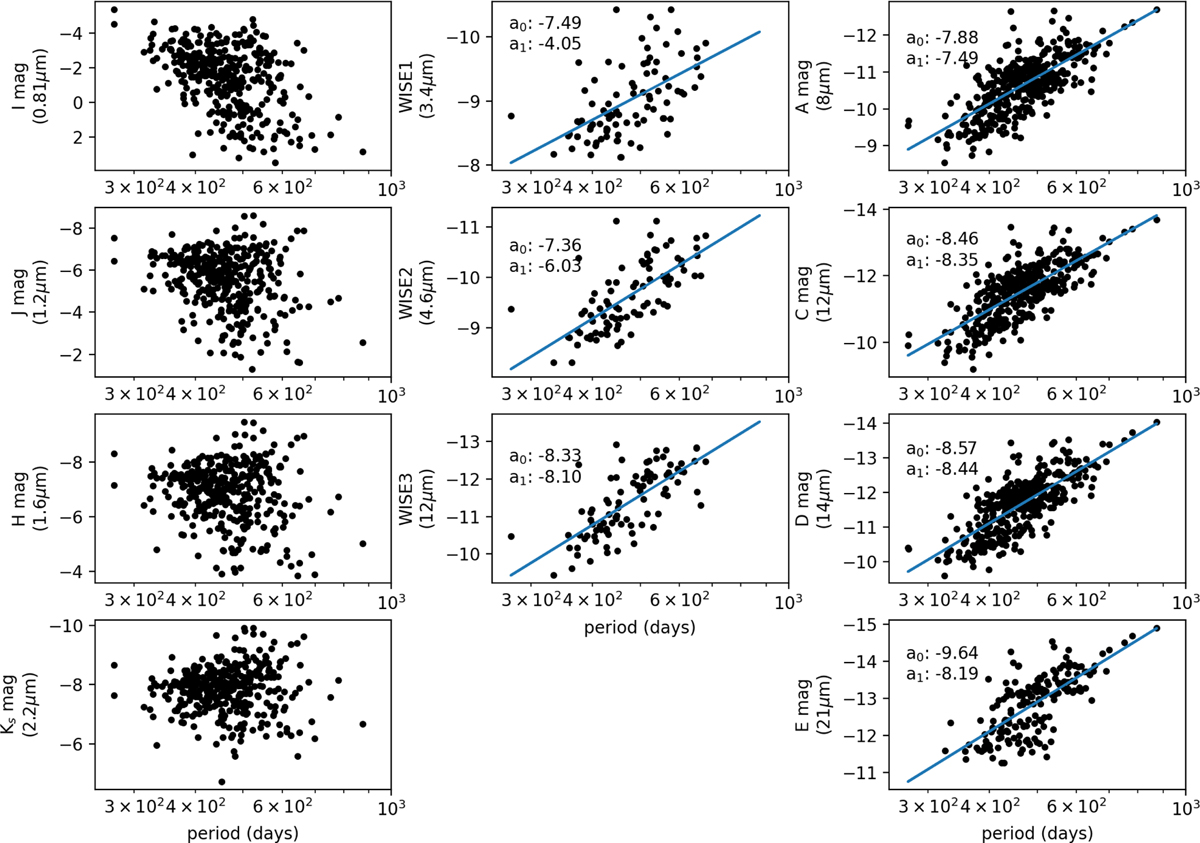
Period versus absolute magnitude plots for wavelengths from 0.9 to 21 μm. The y-axis in each plot is given in absolute magnitudes, where the central wavelengths of the I, J, WISE1, WISE2, WISE3, A, C, D, and E bands are 0.81, 1.25, 3.4, 4.6, 12, 8.0, 12, 14, and 21 μm respectively. Fits and their corresponding parameters are shown for WISE and MSX bands, where the parameters, a0 and a1, are obtained by fitting to the equation M = a0 + a1(log(P) − 2.3).
Current usage metrics show cumulative count of Article Views (full-text article views including HTML views, PDF and ePub downloads, according to the available data) and Abstracts Views on Vision4Press platform.
Data correspond to usage on the plateform after 2015. The current usage metrics is available 48-96 hours after online publication and is updated daily on week days.
Initial download of the metrics may take a while.