Fig. 4
Download original image
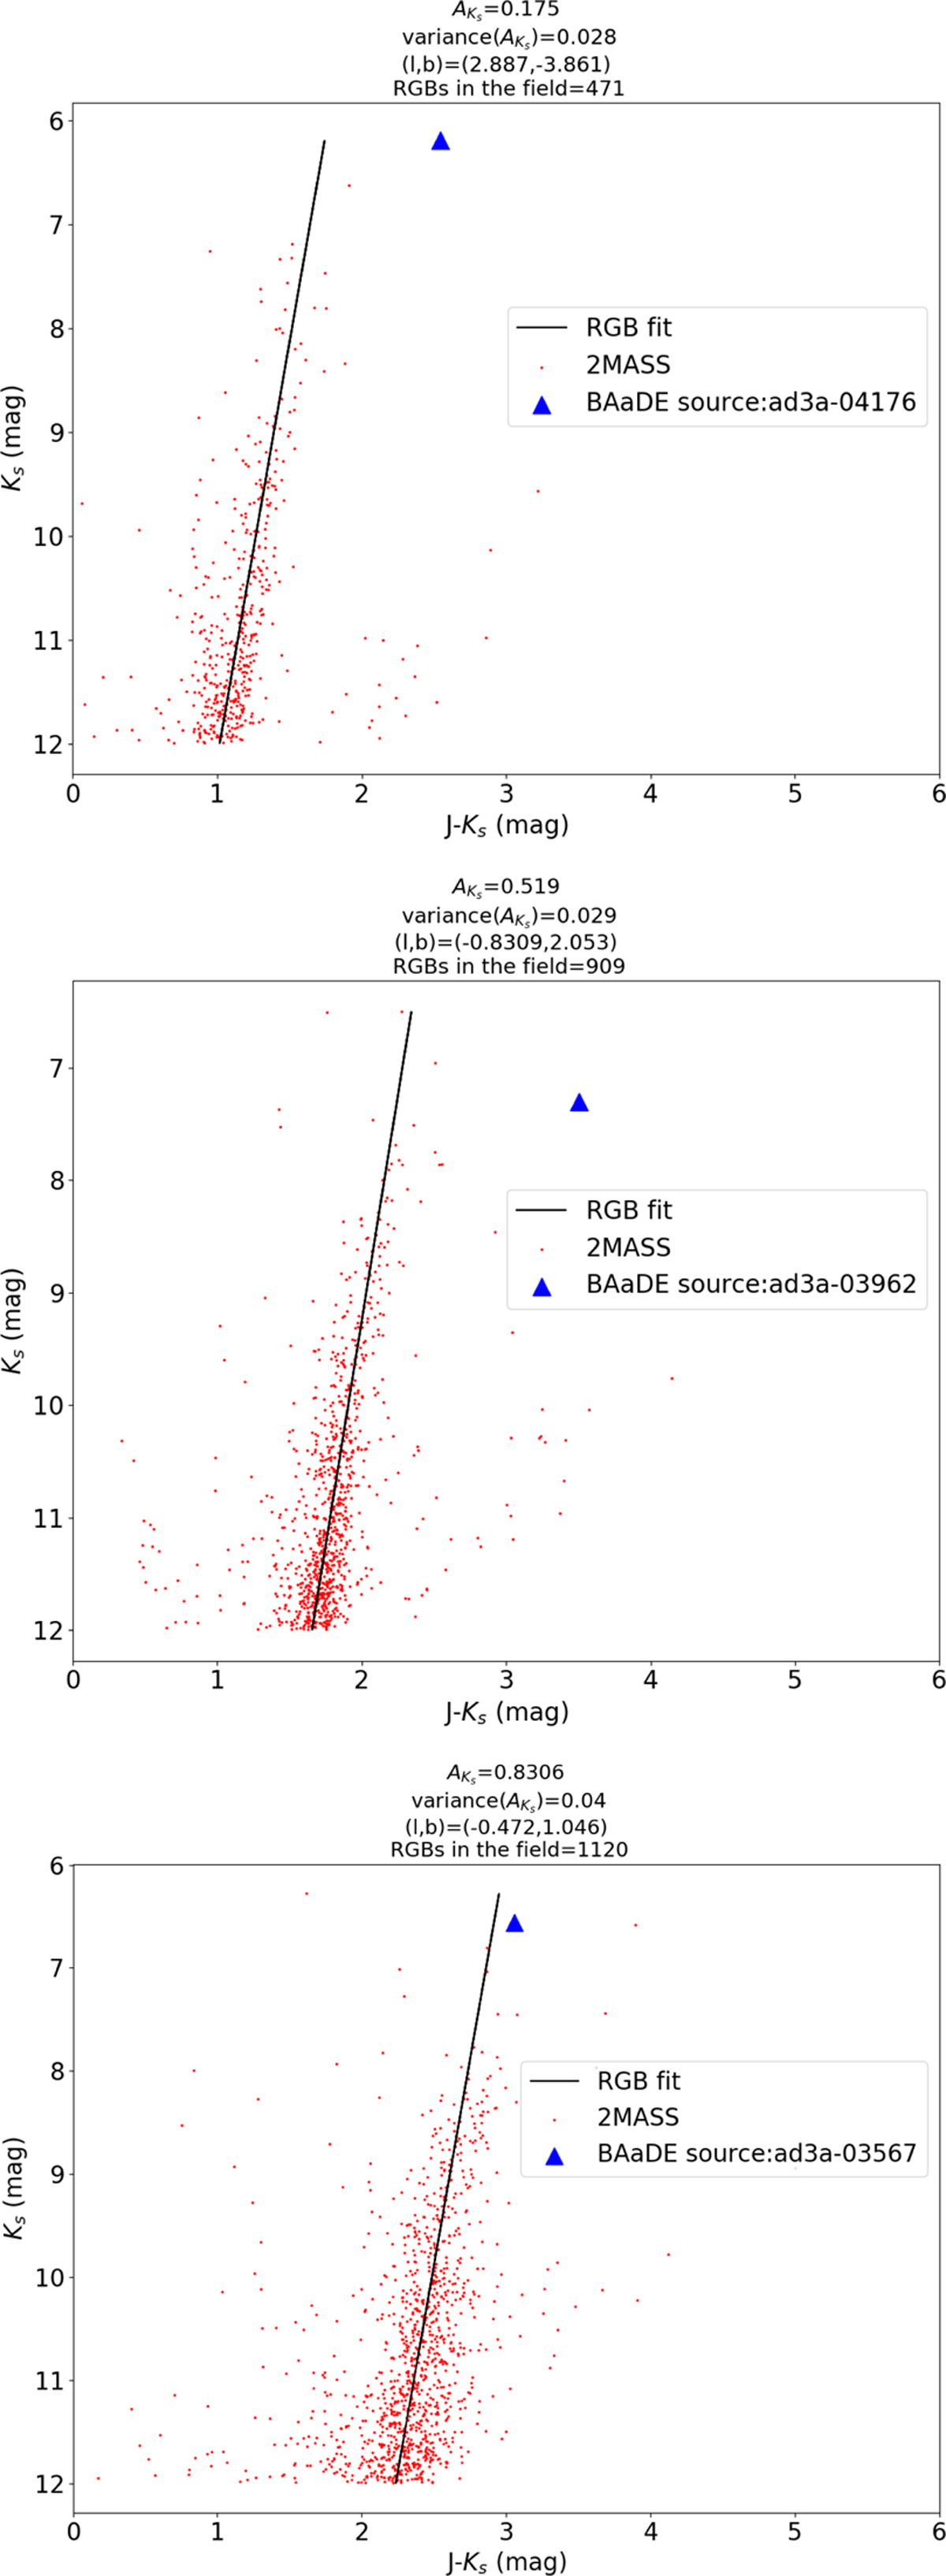
Color versus apparent magnitude plots of 2MASS sources (red dots) along with the much brighter BAaDE source (blue triangle) and our RGB fit (black straight line). All sources are within 4′ of the coordinates shown at the top of each panel. The RGB fit is used to derive the reddening and extinction (![]() , shown at top of plot) as described in the text. This procedure was conducted for each source in the GC sample and these plots are shown as examples of a low-extinction field, and typical-extinction field, and a high-extinction field from top to bottom.
, shown at top of plot) as described in the text. This procedure was conducted for each source in the GC sample and these plots are shown as examples of a low-extinction field, and typical-extinction field, and a high-extinction field from top to bottom.
Current usage metrics show cumulative count of Article Views (full-text article views including HTML views, PDF and ePub downloads, according to the available data) and Abstracts Views on Vision4Press platform.
Data correspond to usage on the plateform after 2015. The current usage metrics is available 48-96 hours after online publication and is updated daily on week days.
Initial download of the metrics may take a while.