Fig. 2
Download original image
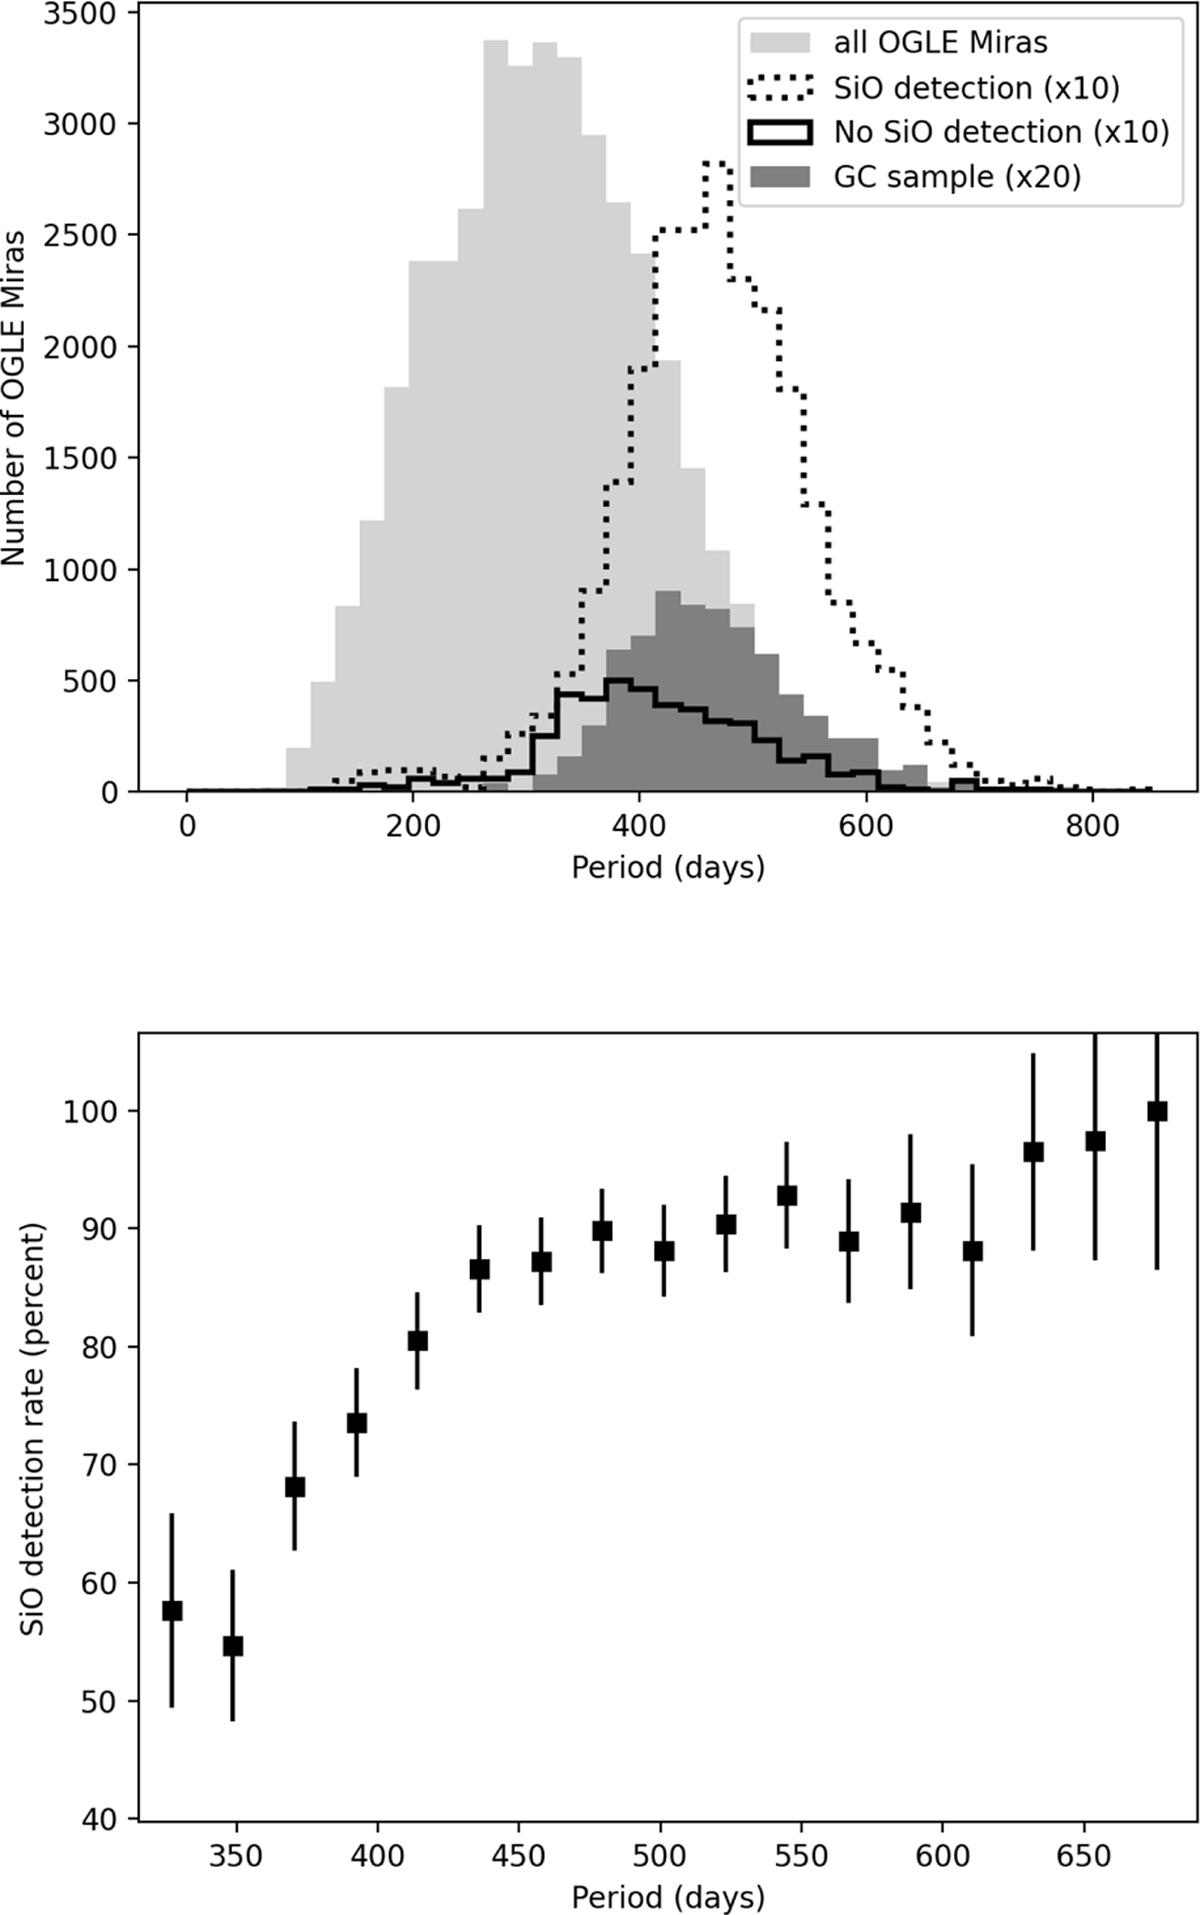
Period distribution of various samples. Top panel: periods, as reported in the OGLE LPV catalog, for all sources identified as Mira variable by the OGLE team (light gray) as well as for sources that have been observed for SiO maser emission by the BAaDE survey (black dotted line showing sources with detections of these masers and solid showing sources without a detection). Also shown are the periods of the GC sample (dark gray). The number of sources in each bin for BAaDE samples and GC sample have been multiplied by 10 and 20, respectively, for readability. Bottom panel: SiO maser detection rate as a function of period derived from the bins in the top panel. Results are shown over the period range with good statistics (~350–650 days). Error bars are determined by the number of sources used to calculate the detection rate and go as ![]() .
.
Current usage metrics show cumulative count of Article Views (full-text article views including HTML views, PDF and ePub downloads, according to the available data) and Abstracts Views on Vision4Press platform.
Data correspond to usage on the plateform after 2015. The current usage metrics is available 48-96 hours after online publication and is updated daily on week days.
Initial download of the metrics may take a while.