Fig. 8
Download original image
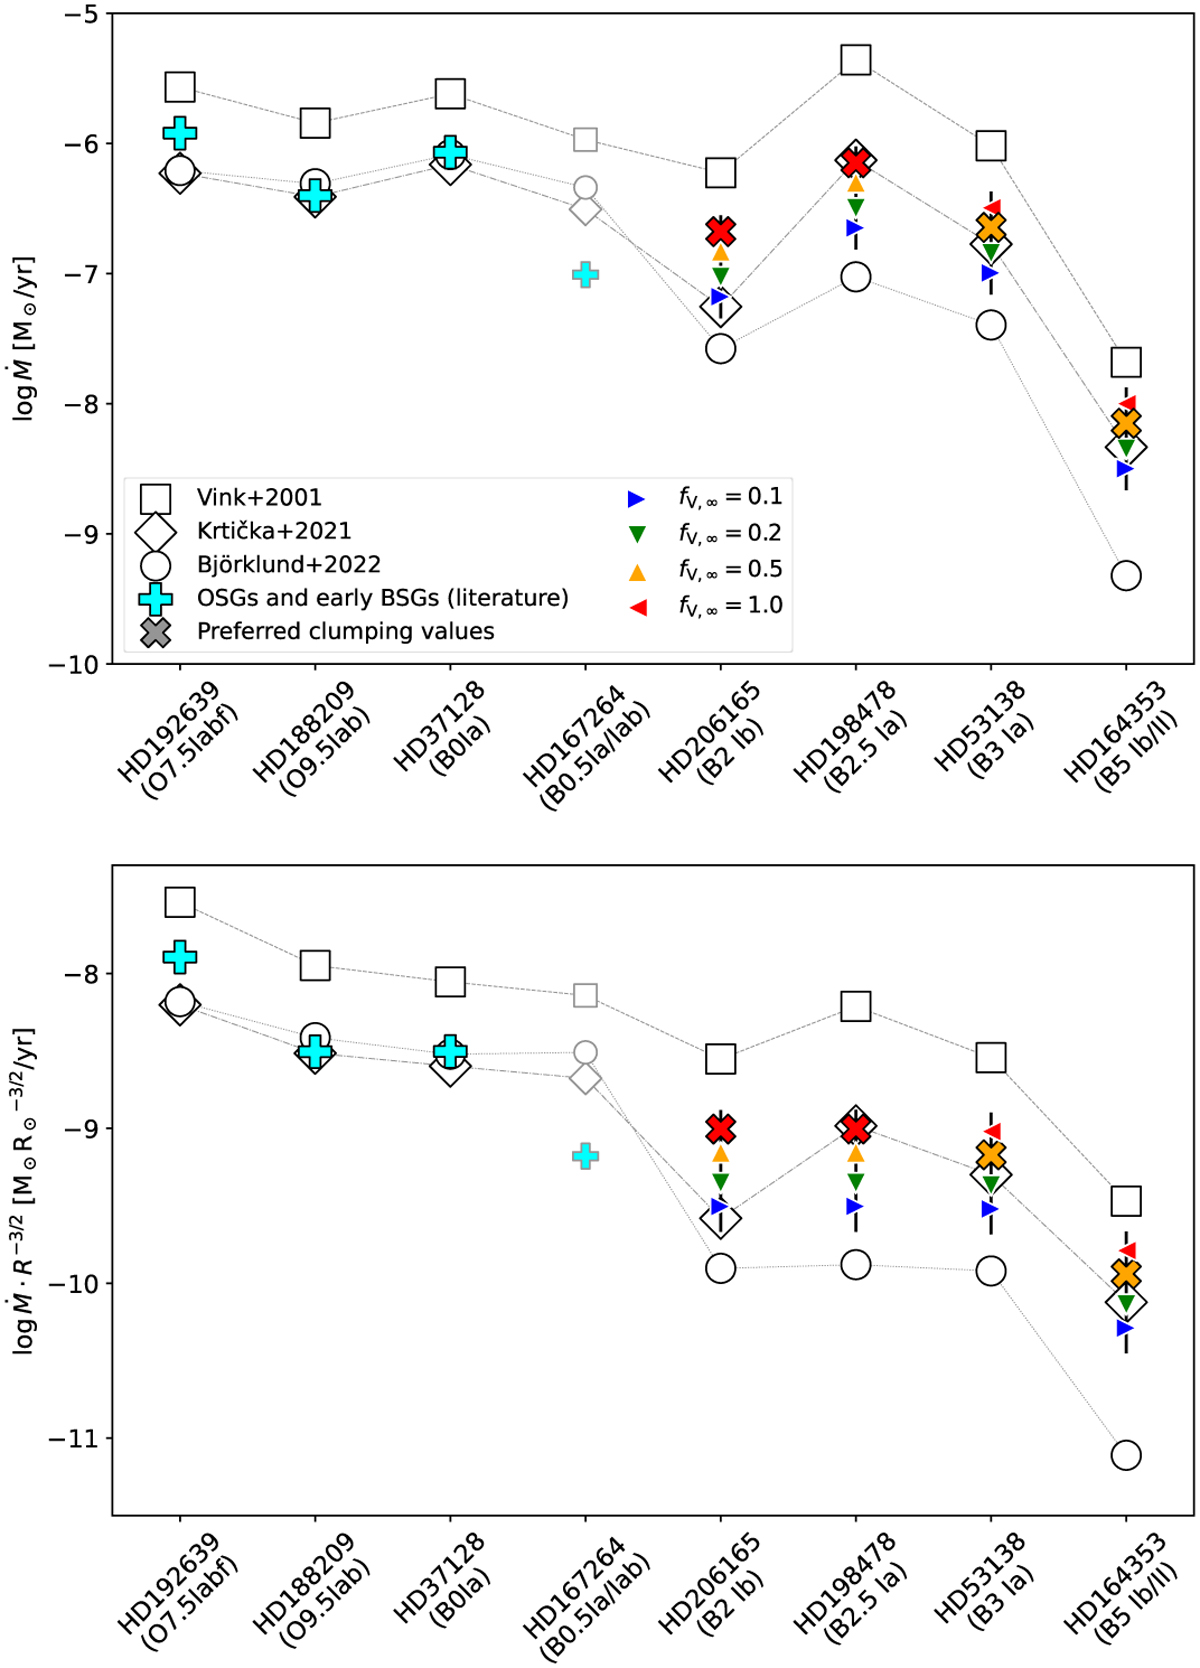
Comparison between our derived mass-loss rates and the predictions according to different recipes, Vink et al. (2000), Krtička et al. (2021), and Björklund et al. (2022), for our sample stars shown in the upper panel. Early BSGs and OSGs, represented with cyan crosses, which were also analyzed using clumping and/or X-rays are included, namely: HD192639 (O7.5Iabf, Bouret et al. 2012), HD188209 (O9.5Iab, Marcolino et al. 2017), HD37128 (ϵ-Ori, B0Ia Puebla et al. 2016) and HD167264 (B0.5Ia/Iab, Martins et al. 2015). Bottom panel shows the same as the upper panel, but with all the stars scaled to the same radii following Puls et al. (2006) scaling relation of OB stars. HD167264 Ṁ values have fainter symbols in order to indicate that the parameters might not be very reliable as the star is a binary (Mahy et al. 2022).
Current usage metrics show cumulative count of Article Views (full-text article views including HTML views, PDF and ePub downloads, according to the available data) and Abstracts Views on Vision4Press platform.
Data correspond to usage on the plateform after 2015. The current usage metrics is available 48-96 hours after online publication and is updated daily on week days.
Initial download of the metrics may take a while.