Open Access
Fig. 3
Download original image
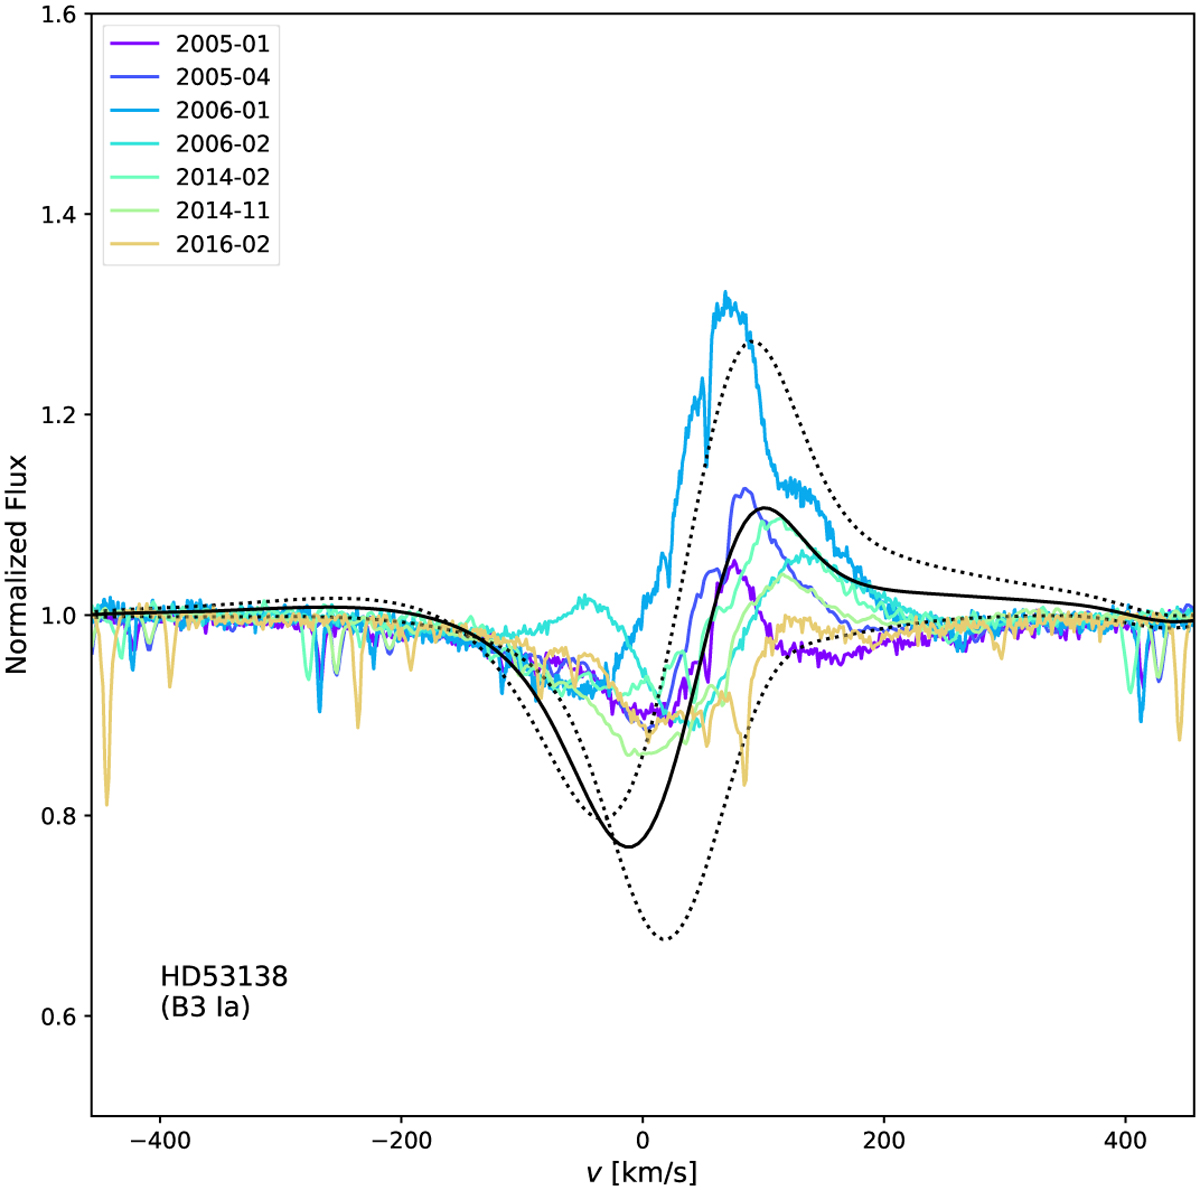
Comparison between synthetic and observational spectrum of HD53138 in the Ha region. The color scheme is the same as in Fig. 2 while the black filled line represents the preferred model while the and dotted lines represent models with an increase/decrease in M by a factor of 30%.
Current usage metrics show cumulative count of Article Views (full-text article views including HTML views, PDF and ePub downloads, according to the available data) and Abstracts Views on Vision4Press platform.
Data correspond to usage on the plateform after 2015. The current usage metrics is available 48-96 hours after online publication and is updated daily on week days.
Initial download of the metrics may take a while.