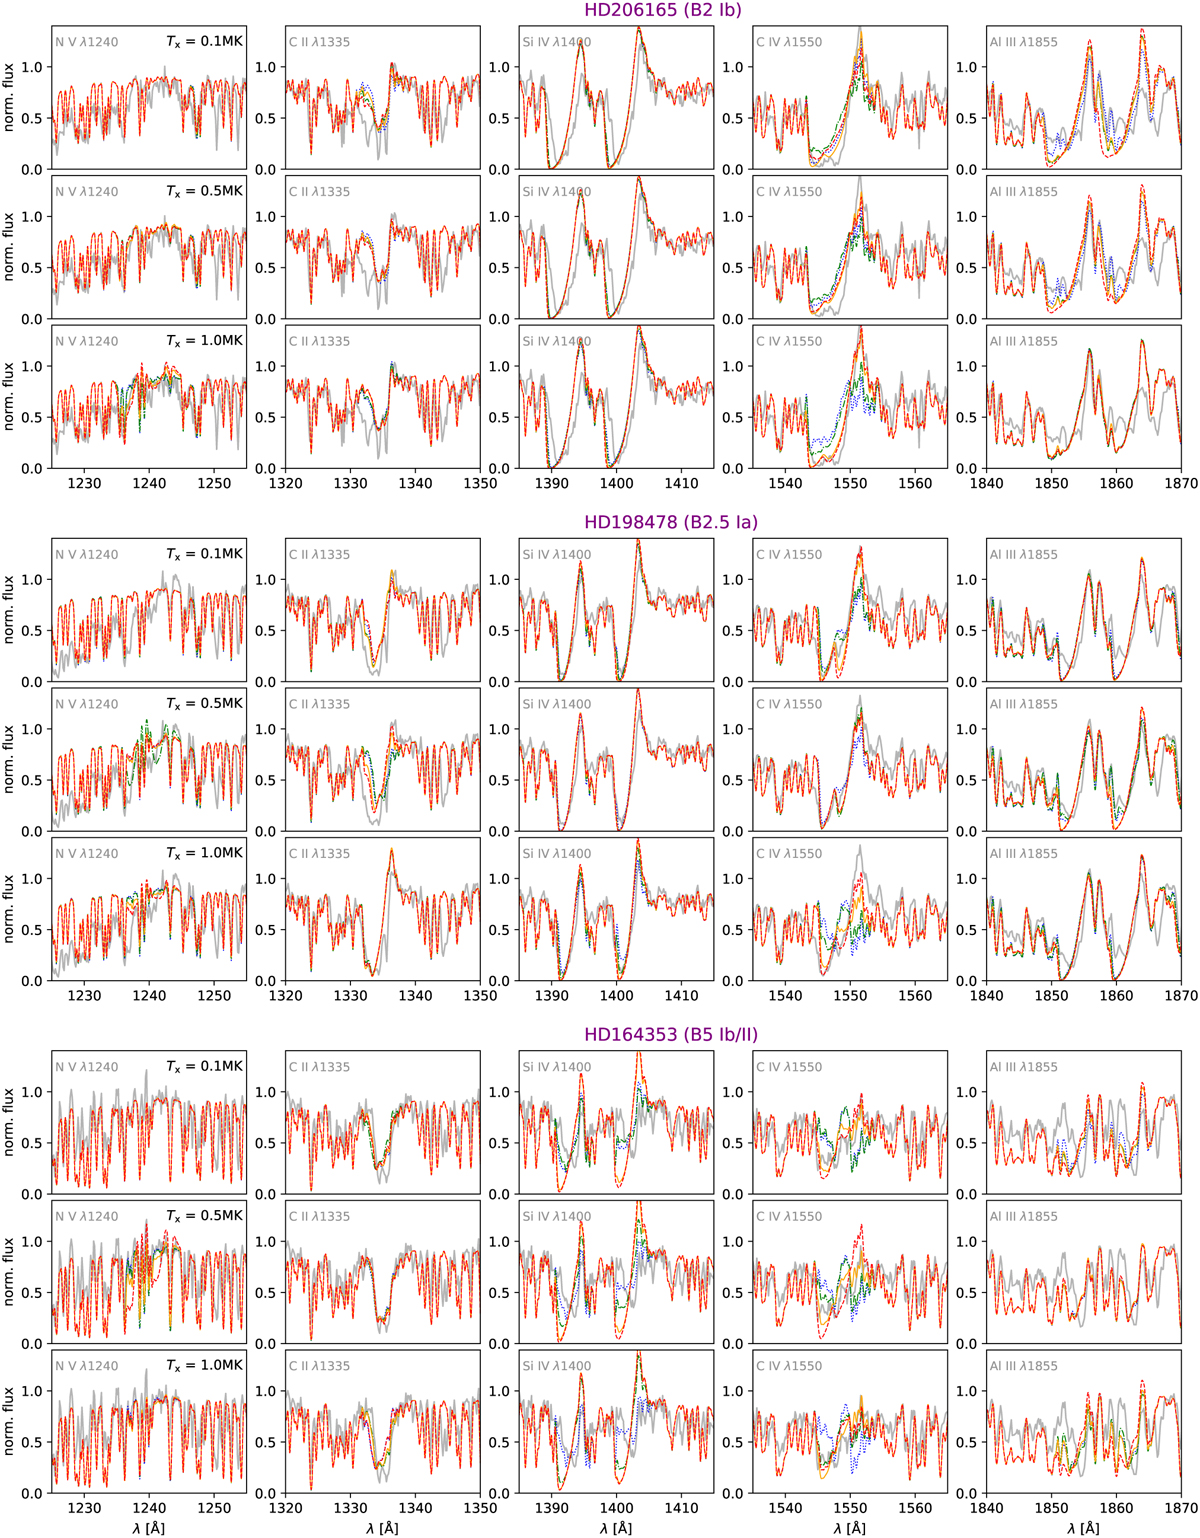
Fig. B.2
Download original image
Best-fitting models for the main UV lines of HD206165, HD198478 and HD164353. Each row of plots shows the lines of the same model with a given shock temperature Tx. The different colors/line styles represent the different adopted values of clumping, namely: red-dashed stands for f∞ = 1.0, orange/full for f∞ = 0.5, green-dash-dotted for f∞ = 0.2 and blue-dotted for f∞ = 0.1. The associated log(Lx/L) and Ṁ for each clumping and shock temperature value are displayed in Tables 6 and 7.
Current usage metrics show cumulative count of Article Views (full-text article views including HTML views, PDF and ePub downloads, according to the available data) and Abstracts Views on Vision4Press platform.
Data correspond to usage on the plateform after 2015. The current usage metrics is available 48-96 hours after online publication and is updated daily on week days.
Initial download of the metrics may take a while.