Open Access
Fig. 11
Download original image
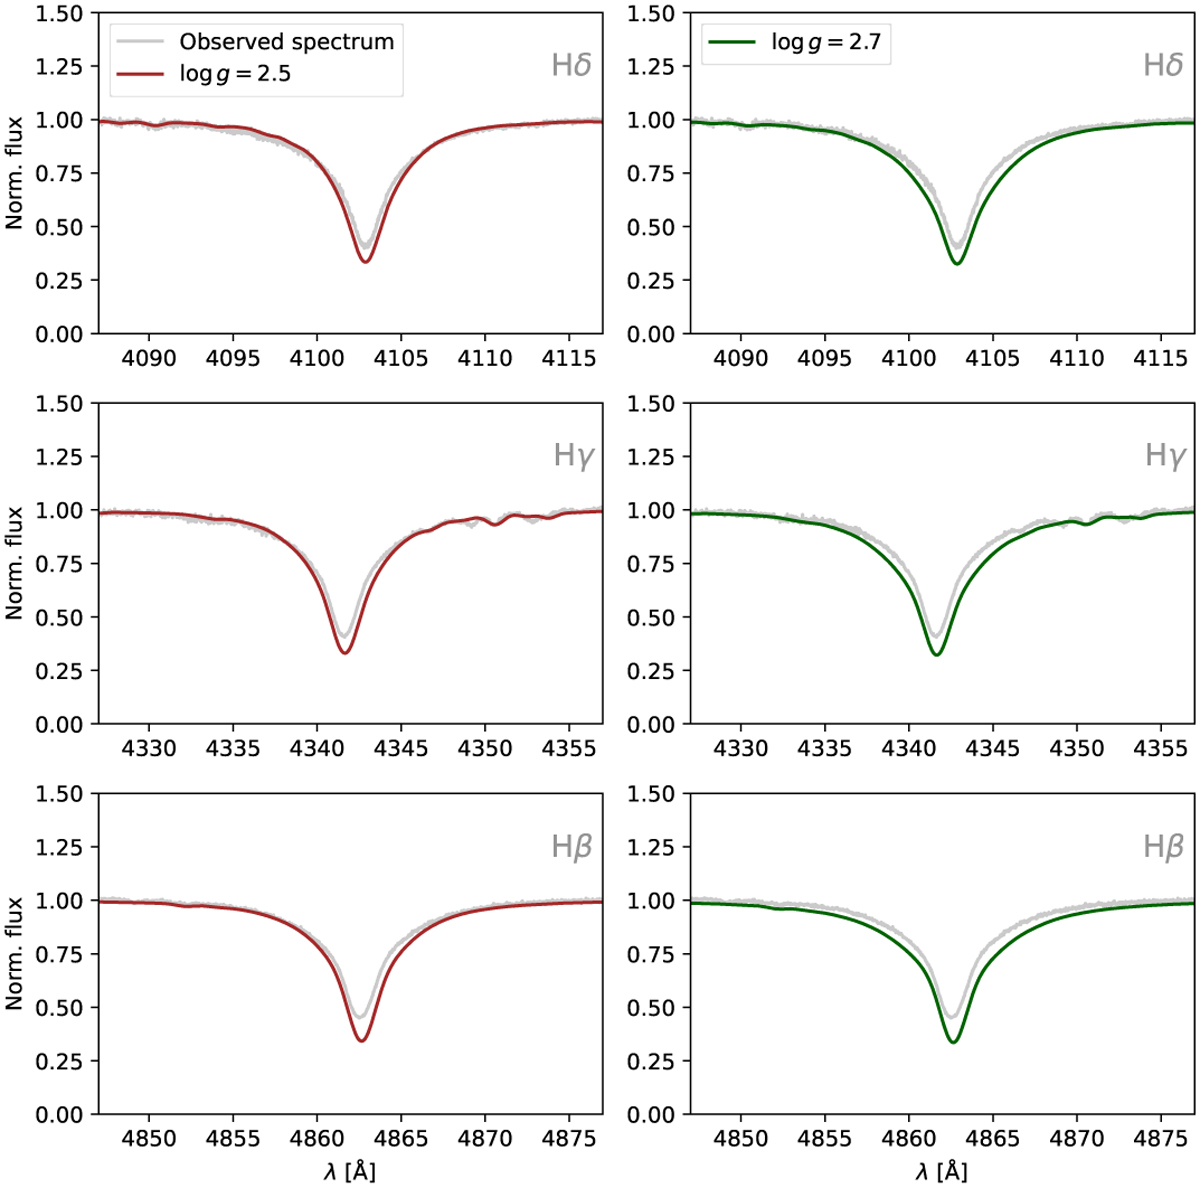
Comparison between models with different log g for HD164353. The left panels show the Balmer lines for the model with log g = 2.5 (brown lines), while the right panels depict the model with log g = 2.7 (green line).
Current usage metrics show cumulative count of Article Views (full-text article views including HTML views, PDF and ePub downloads, according to the available data) and Abstracts Views on Vision4Press platform.
Data correspond to usage on the plateform after 2015. The current usage metrics is available 48-96 hours after online publication and is updated daily on week days.
Initial download of the metrics may take a while.