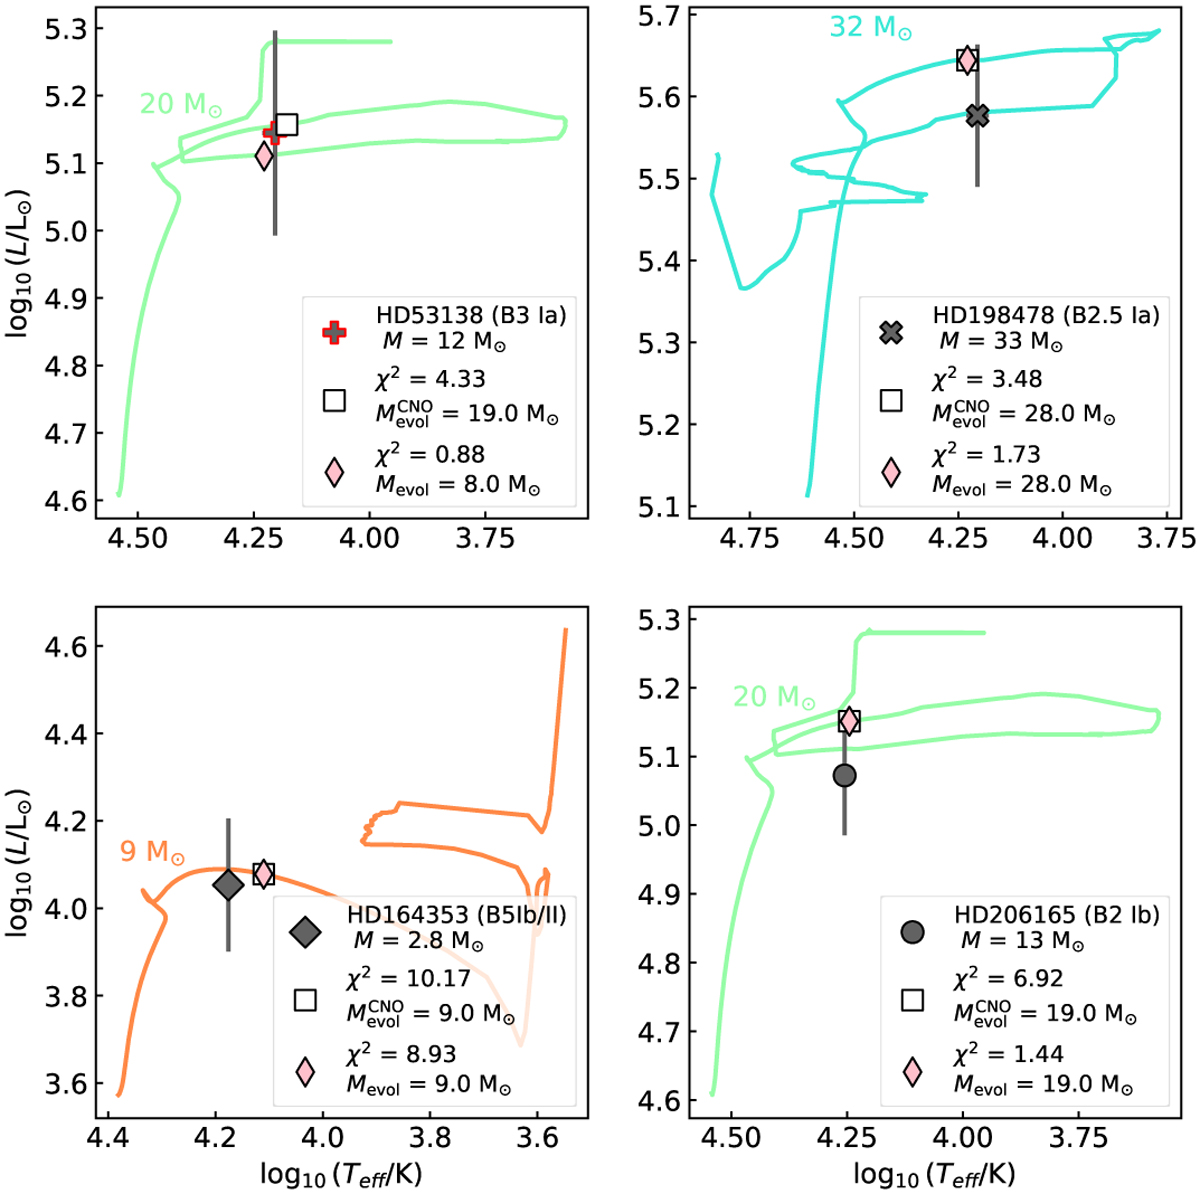
Fig. 10
Download original image
Individual comparison of each BSG in the HRD with each of the best-fitted points (through an χ2 minimization) at the evolutionary tracks of Ekström et al. (2012). The pink diamonds indicate the best model considering Teff, L, log g, while the white squares indicate the same but with the CNO abundances taken into account. For most stars, except HD53138, the result is exactly the same.
Current usage metrics show cumulative count of Article Views (full-text article views including HTML views, PDF and ePub downloads, according to the available data) and Abstracts Views on Vision4Press platform.
Data correspond to usage on the plateform after 2015. The current usage metrics is available 48-96 hours after online publication and is updated daily on week days.
Initial download of the metrics may take a while.