Fig. 1
Download original image
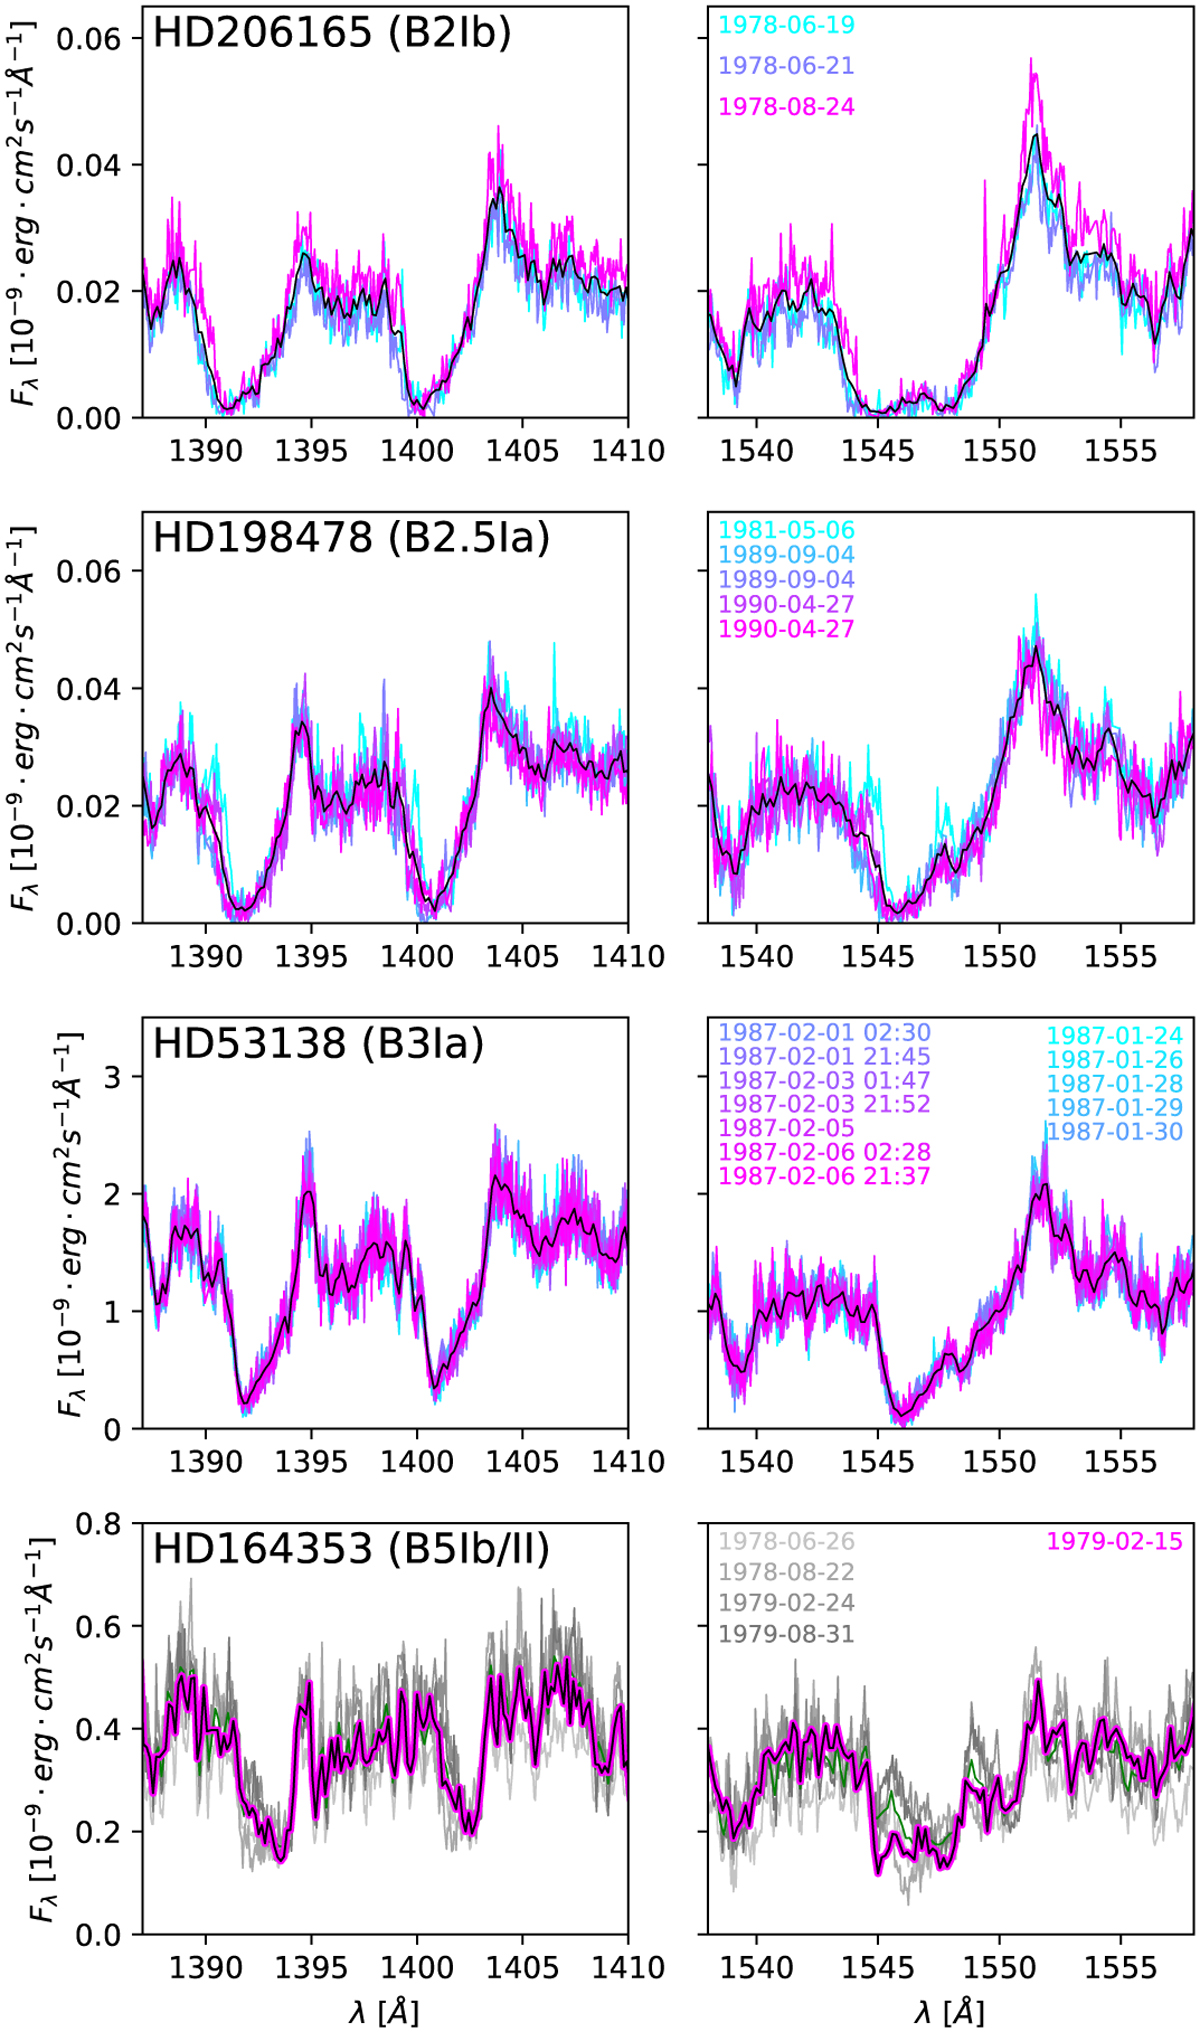
UV spectra of our sample stars – CIV 1550 and Si IV 1400 region. Note: variability is absent or mild in the available IUE data as the profiles do not present drastic changes (e.g. appearance/destruction of P-Cygni profile or variations in the width). The black profiles are the computed average IUE spectra which were used for the model comparison. For HD164353, the green lines represent small aperture IUE data (re-scaled to match the flux of the large aperture acquisition). The black thick lines are the averaged spectra which were used for model comparison (see Sect. 3).
Current usage metrics show cumulative count of Article Views (full-text article views including HTML views, PDF and ePub downloads, according to the available data) and Abstracts Views on Vision4Press platform.
Data correspond to usage on the plateform after 2015. The current usage metrics is available 48-96 hours after online publication and is updated daily on week days.
Initial download of the metrics may take a while.