Fig. 7
Download original image
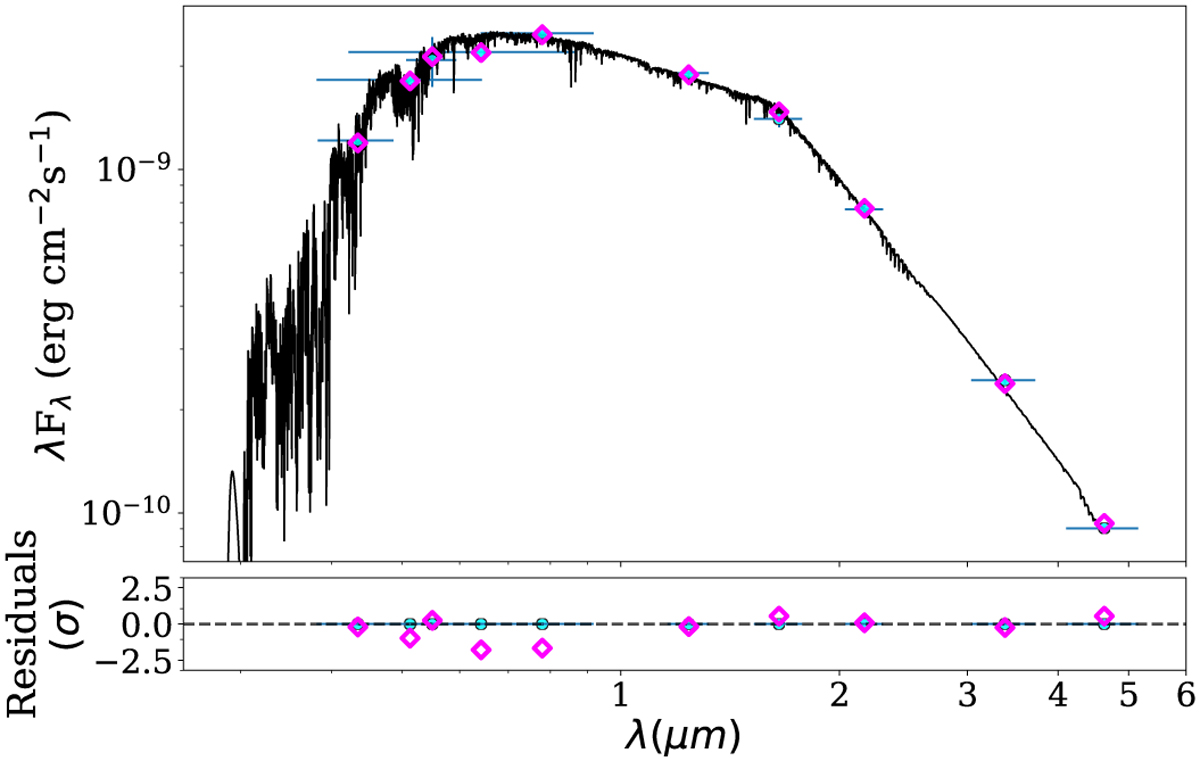
SED of TOI-1416. The best fitting model from the Phoenix v2 grids is shown in black. The observed photometry is marked with cyan circles, and the synthetic photometry with magenta diamonds. The horizontal bars of the observations indicate the effective widths of the passbands, while the vertical bars mark the 1 σ uncertainties. The lower panel shows the residuals normalized to the errors of the photometry, which causes the most precise photometry to display the largest scatter.
Current usage metrics show cumulative count of Article Views (full-text article views including HTML views, PDF and ePub downloads, according to the available data) and Abstracts Views on Vision4Press platform.
Data correspond to usage on the plateform after 2015. The current usage metrics is available 48-96 hours after online publication and is updated daily on week days.
Initial download of the metrics may take a while.