Fig. F.1
Download original image
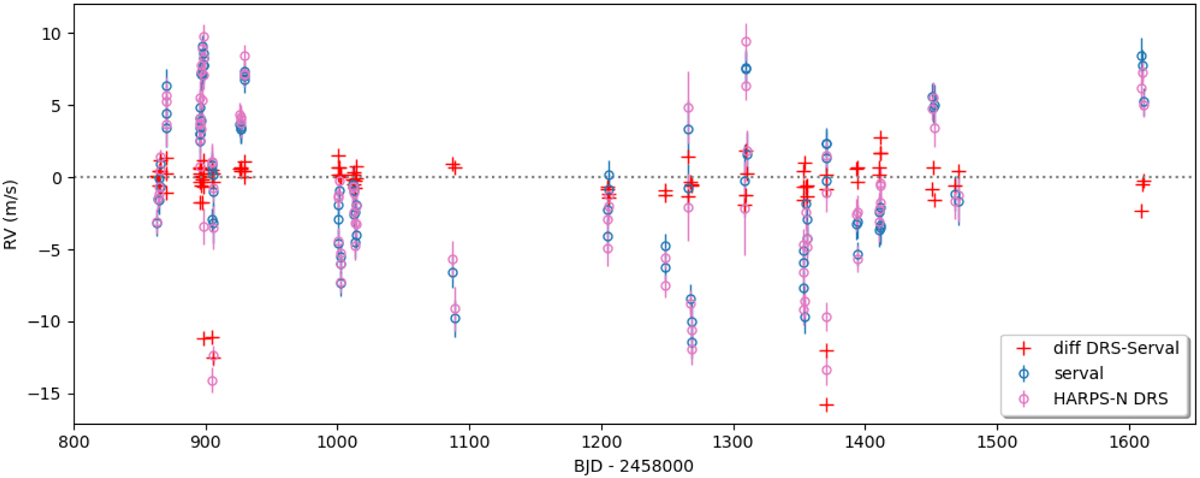
Comparison between HARPS-N RVs measured with the HARPS-N DRS from CCFs (open red circles) and with serval (open green circles). The red crosses show the difference between the two data-sets. The five points in which this difference is significantly negative correspond to exposures that were prematurely terminated, and which are not correctly processed by DRS. Both data-sets have been averaged to zero without considering these five points. The difference between the two data-sets has a standard deviation of 0.92 m s−1 (excluding again these five points).
Current usage metrics show cumulative count of Article Views (full-text article views including HTML views, PDF and ePub downloads, according to the available data) and Abstracts Views on Vision4Press platform.
Data correspond to usage on the plateform after 2015. The current usage metrics is available 48-96 hours after online publication and is updated daily on week days.
Initial download of the metrics may take a while.