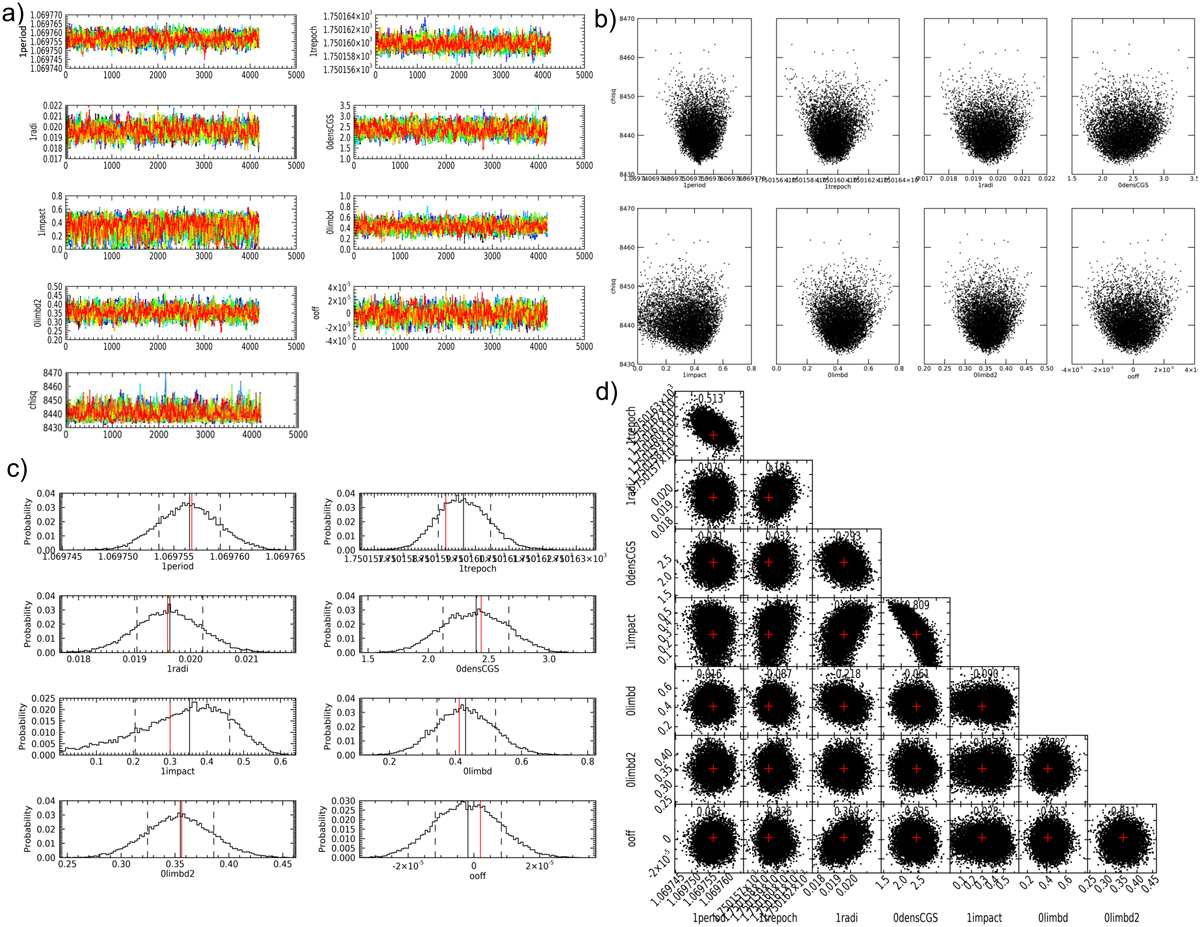
Fig. C.1
Download original image
Graphical output from MCMC sequence performed by UFIT that led to the results reported in Table 7. In all panels, the parameters are indicated by the keywords used in UFIT: “1period” for the planet period, “1trepoch” for the epoch of transit, “1radi” for the relative planet radius, “0densCGS” for the stellar density in CGS units, “1impact” for the impact parameter, “0limbd” and “0limbd2” for the LD coefficients q1 and q2, and “ooff” for the off-transit flux-offset against zero. The sub-figures are: (a) Values of the parameters against link-number of the MCMC sequence, excluding burn-in. Each MCMC chain is shown by a different color. The lowest panel shows the evaluation of the χ2 values. (b) Scatter plot of parameters versus the χ2 value. (c) Histograms of parameter distributions. The median value is shown by the vertical black line; the dashed lines delimit the 68.3% credible interval and the red line gives the value of the best fit. (d) Corner plot of the correlations among parameters. The red crosses give the values of the best fit.
Current usage metrics show cumulative count of Article Views (full-text article views including HTML views, PDF and ePub downloads, according to the available data) and Abstracts Views on Vision4Press platform.
Data correspond to usage on the plateform after 2015. The current usage metrics is available 48-96 hours after online publication and is updated daily on week days.
Initial download of the metrics may take a while.