Fig. B.4
Download original image
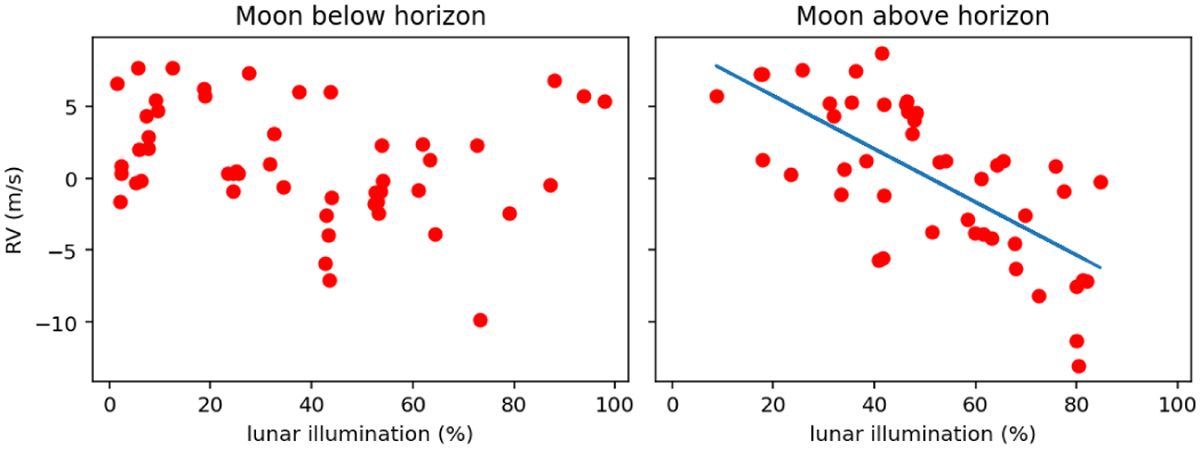
Similar to Fig. B.3, but the HARPS-N RVs are plotted against the lunar illumination at the time of observation, and the data are separated into panels containing only RVs that were taken when the Moon was below or above the horizon. The blue line in the right panel shows a linear fit to the RV versus illumination dependence, which has a correlation coefficient of −0.69.
Current usage metrics show cumulative count of Article Views (full-text article views including HTML views, PDF and ePub downloads, according to the available data) and Abstracts Views on Vision4Press platform.
Data correspond to usage on the plateform after 2015. The current usage metrics is available 48-96 hours after online publication and is updated daily on week days.
Initial download of the metrics may take a while.