Fig. 16
Download original image
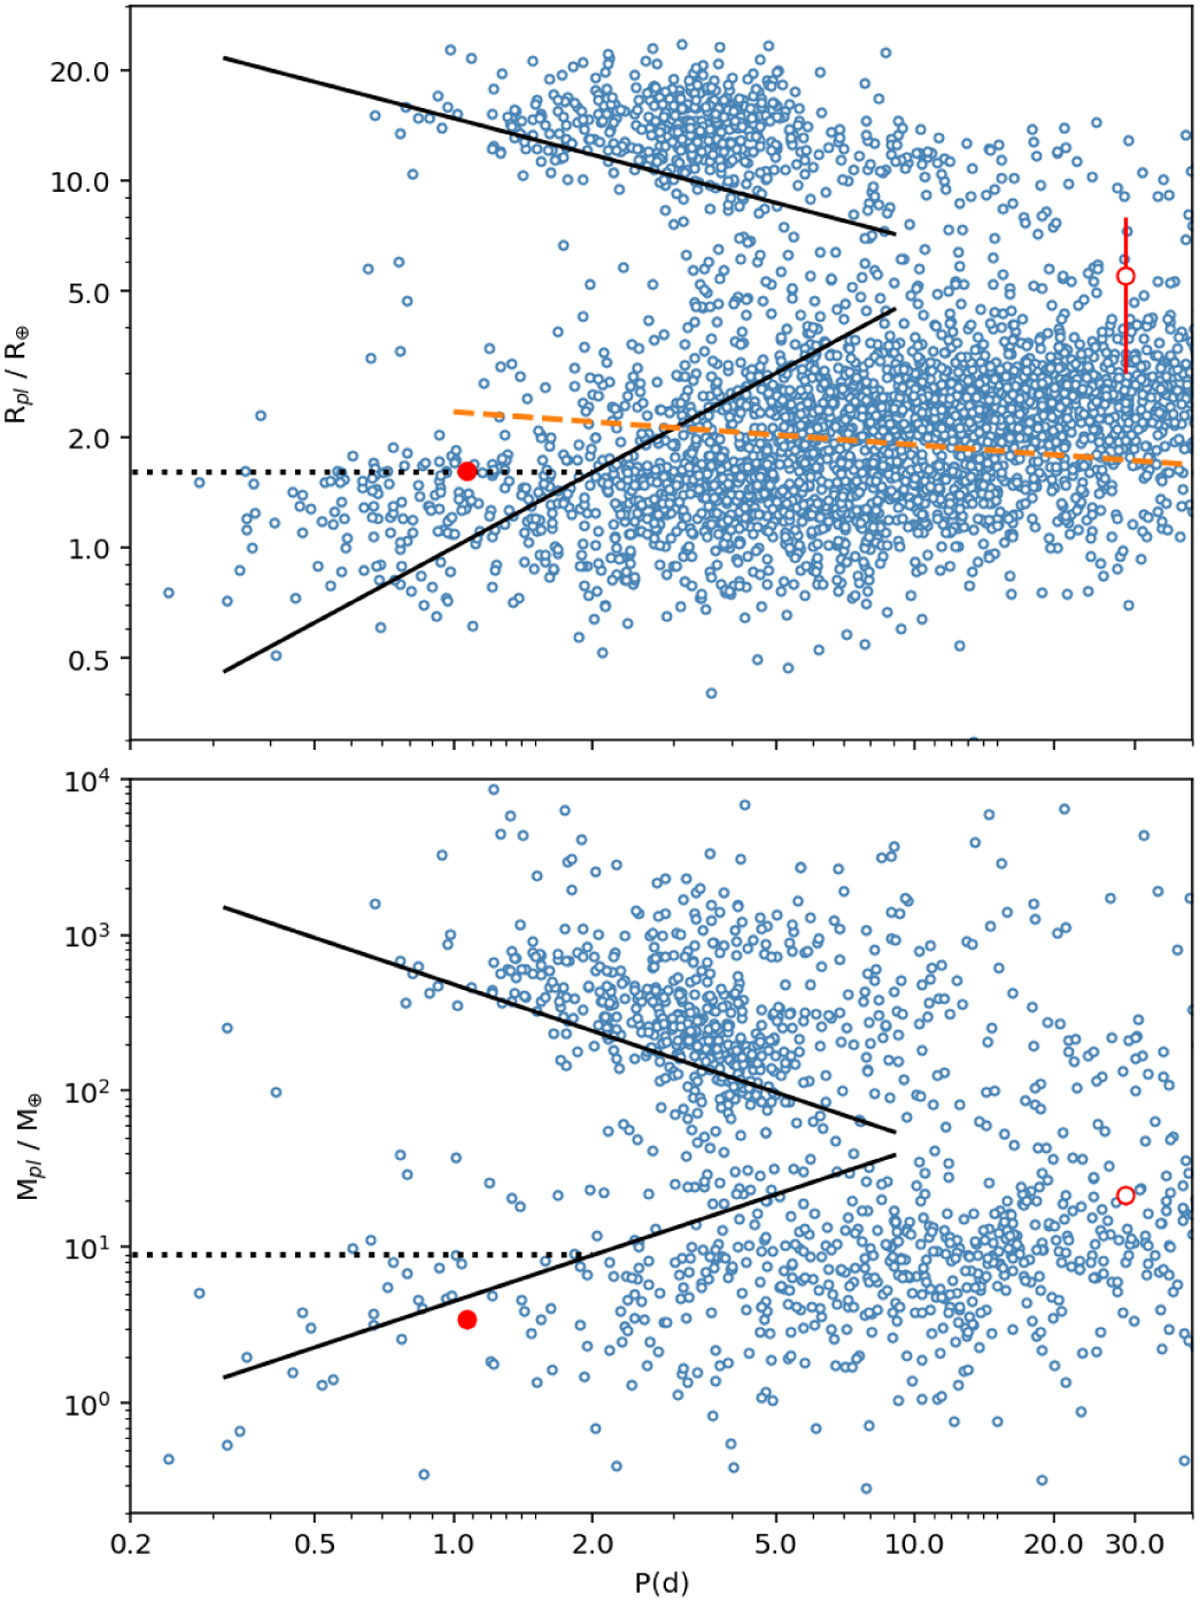
Diagram of the radii (top panel) and. masses (bottom panel) versus period of the known planets, from the NASA Exoplanet Archive. The solid black lines show the delineation of the “Neptune Desert” from Mazeh et al. (2016), whereas the horizontal dotted black lines show the lower limits to the Neptune Desert for periods ≤2 days that are proposed in this work. The dashed orange line in the upper panel indicates the period-radius valley from Van Eylen et al. (2018). TOI-1416 b is indicated by the filled red circle and the tentative planet c by the unfilled one.
Current usage metrics show cumulative count of Article Views (full-text article views including HTML views, PDF and ePub downloads, according to the available data) and Abstracts Views on Vision4Press platform.
Data correspond to usage on the plateform after 2015. The current usage metrics is available 48-96 hours after online publication and is updated daily on week days.
Initial download of the metrics may take a while.