Fig. 13
Download original image
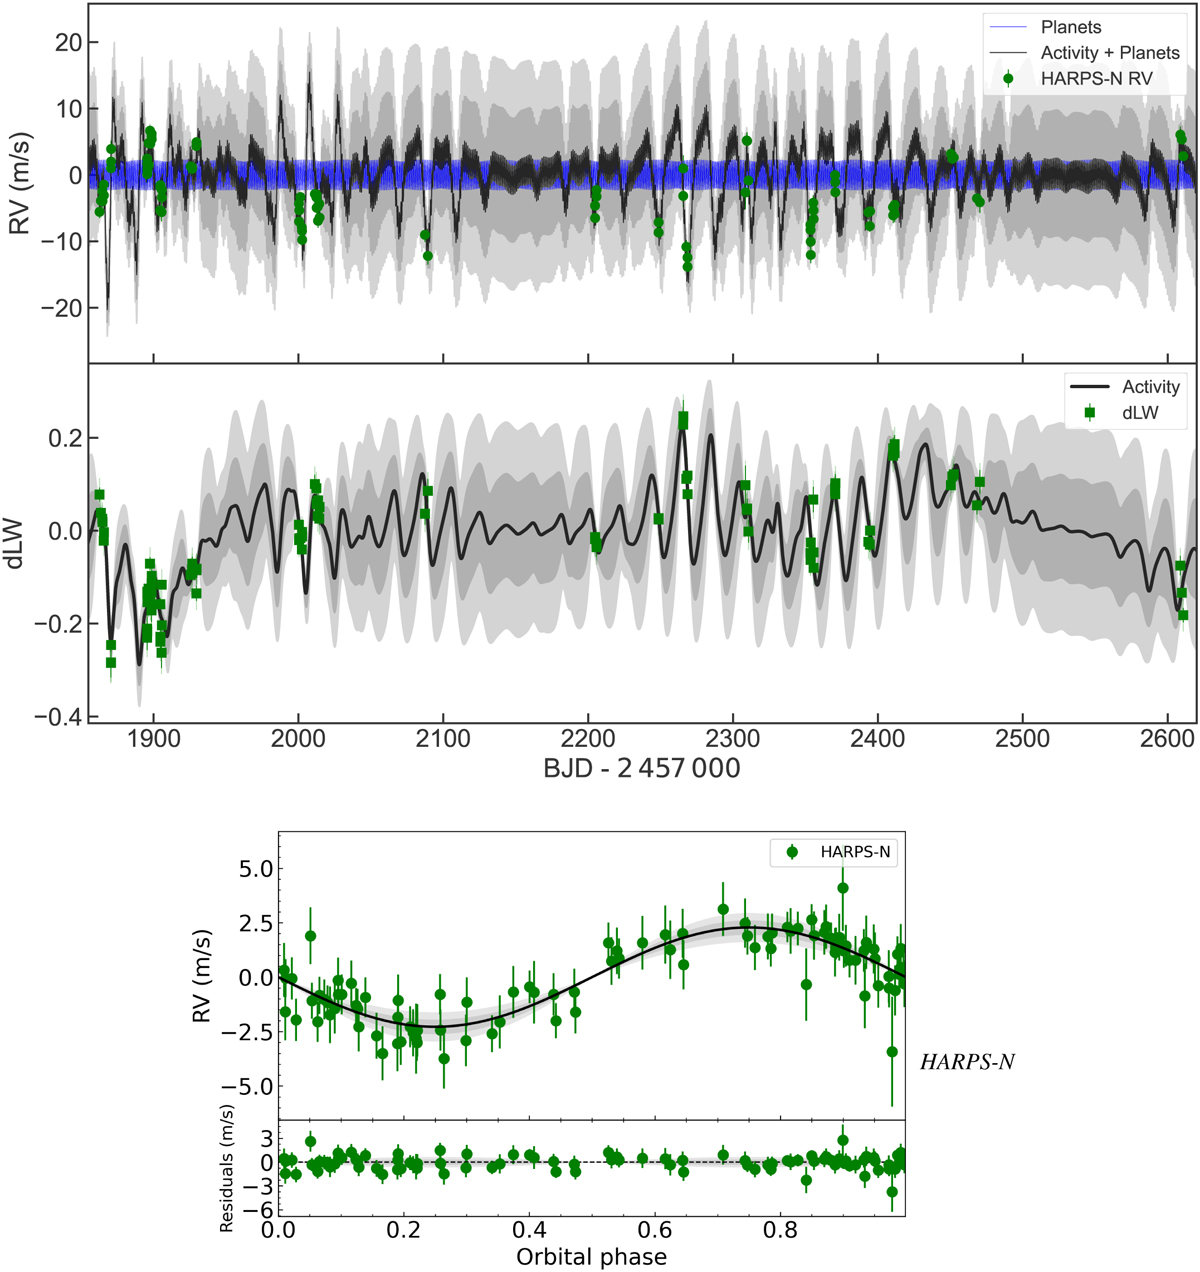
Modeling of HARPS-N spectroscopy with pyaneti. Upper panel: RV and dLW time series for Model 1, assuming only the presence of a Keplerian signal with the 1.07 days transit period. The green markers in each panel represent the RV and dLW measurements. The solid black curve shows the inferred multi-GP model, with dark and light shaded areas showing the one and two sigma credible intervals of the corresponding GP model. We note that the short period of the planet and the size of the plot make the RV sinusoids appear as a solid blue band. Lower panel: HARPS-N RV data folded on the 1.07-day orbital period of planet b, after subtraction of the systemic velocity and the GP noise model. The inferred RV model is shown as a solid black curve with 1- and 2-sigma credible intervals (shaded areas).
Current usage metrics show cumulative count of Article Views (full-text article views including HTML views, PDF and ePub downloads, according to the available data) and Abstracts Views on Vision4Press platform.
Data correspond to usage on the plateform after 2015. The current usage metrics is available 48-96 hours after online publication and is updated daily on week days.
Initial download of the metrics may take a while.