Fig. 11
Download original image
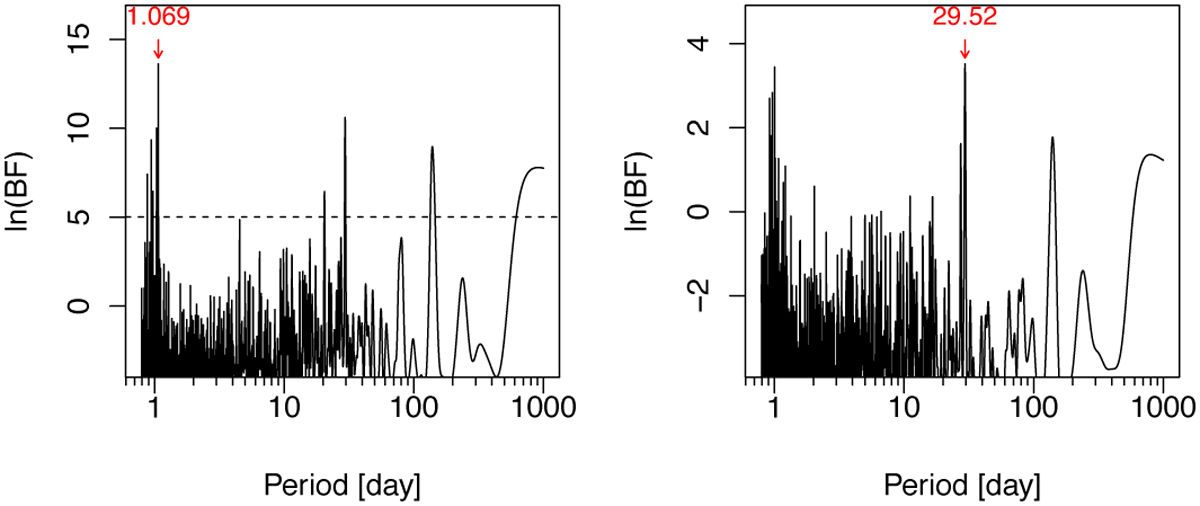
Left panel: Bayes factor periodogram of the HARPS-N RVs generated by agatha (Feng et al. 2017), using one MA component. The vertical axis provides the probability of peaks being real, in terms of the logarithm of their Bayes factor (BF). The period of the highest peak is indicated, which corresponds to the period of the transits of TOI-1416 b. Right panel: Like the left panel, but after the removal of the 1.069 days signal, now showing a signal at 29.52 days as the highest one.
Current usage metrics show cumulative count of Article Views (full-text article views including HTML views, PDF and ePub downloads, according to the available data) and Abstracts Views on Vision4Press platform.
Data correspond to usage on the plateform after 2015. The current usage metrics is available 48-96 hours after online publication and is updated daily on week days.
Initial download of the metrics may take a while.