Fig. 1
Download original image
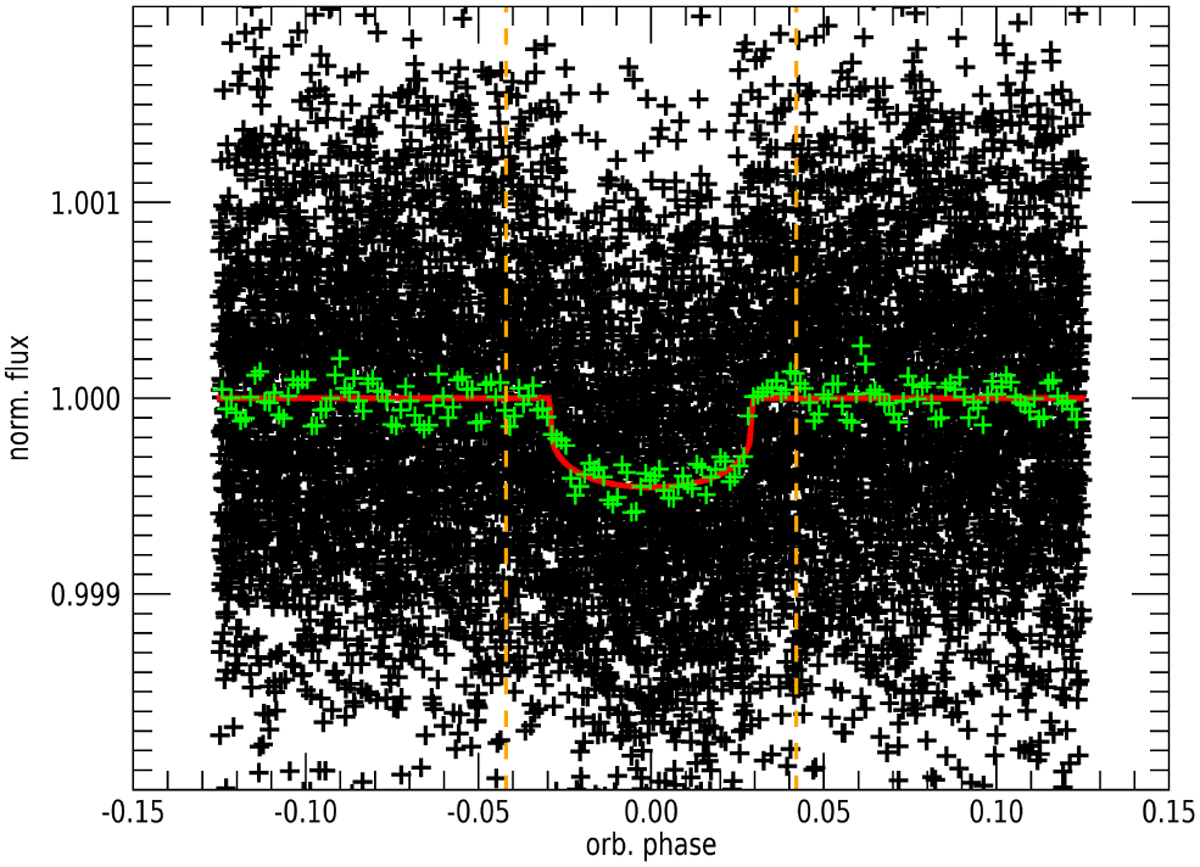
Phased light curve around the transits of TOI-1416 b. Black crosses represent the TESS light curve, after phasing by the planet’s period against the adopted ephemeris and the correction against gradients in the off-transit sections, as described in Sect. 2. Green crosses represent the same curve after a box-car smoothing over 100 phased data points and posterior binning over 50 points. We note that the average time increment between the binned points is 126 seconds, which is very similar to the 120 s temporal resolution of TESS light curves. The red curve is the transit model generated with UTM/UFIT, described in Appendix C. The vertical dashed orange lines indicate the limits between the on-transit and off-transit sections.
Current usage metrics show cumulative count of Article Views (full-text article views including HTML views, PDF and ePub downloads, according to the available data) and Abstracts Views on Vision4Press platform.
Data correspond to usage on the plateform after 2015. The current usage metrics is available 48-96 hours after online publication and is updated daily on week days.
Initial download of the metrics may take a while.