Fig. 5
Download original image
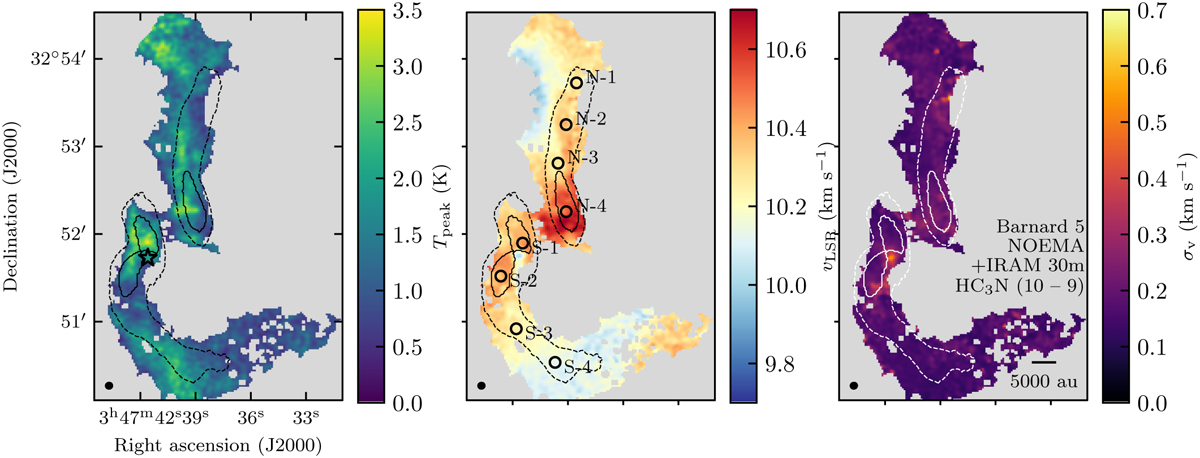
Peak intensity, central velocity, and velocity dispersion resulting from the Gaussian fit to the HC3N (10−9) spectra. Black and white dashed contours represent the edges of the filaments as defined in P15 and S21. The black and white solid contours mark the condensations as defined in P15. The black star marks the position of B5-IRS1. Black labeled circles indicate the position of the sampled spectra in Fig. 6. The black ellipse represents the beam size. The scalebar at the bottom right corner of the right panel represents a length of 5000 au.
Current usage metrics show cumulative count of Article Views (full-text article views including HTML views, PDF and ePub downloads, according to the available data) and Abstracts Views on Vision4Press platform.
Data correspond to usage on the plateform after 2015. The current usage metrics is available 48-96 hours after online publication and is updated daily on week days.
Initial download of the metrics may take a while.