Fig. G.1
Download original image
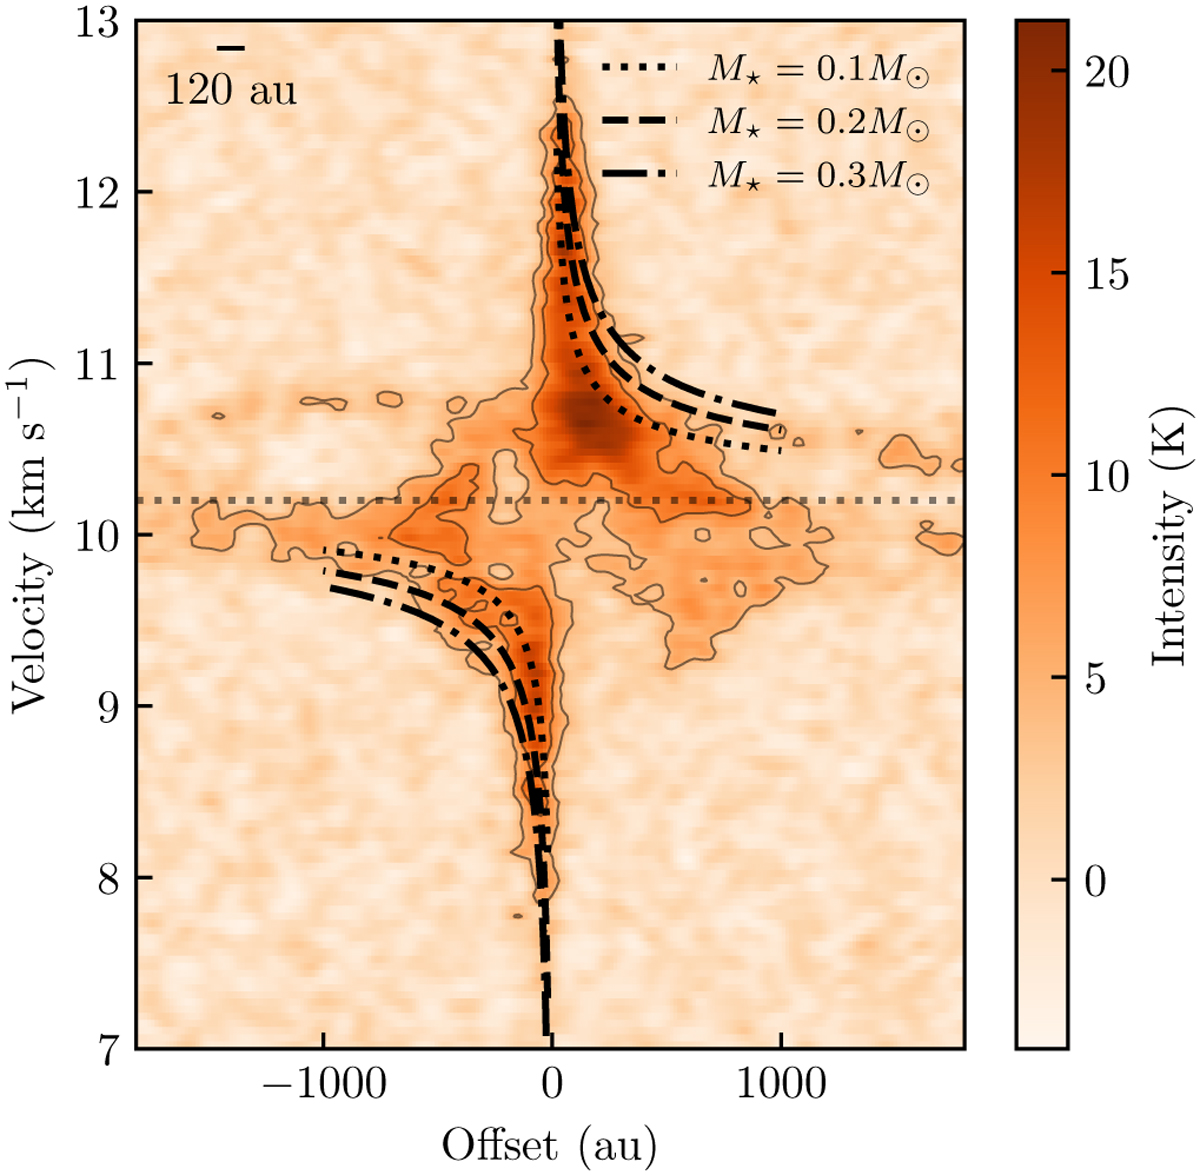
Position-velocity diagram of the ALMA C18O datacube, centered at the position of the protostar, with a PA of 157°.1 and a width of 0″.4. The black curves show the Keplerian rotation profile produced by three protostellar massses: the dotted line shows the Keplerian curve for a protostar of 0.1 M⊙ (Brassfield & Bourke 2011), the dashed line for 0.2 M⊙, and the dash-dotted line for 0.3 M⊙. The dotted horizontal line marks the protostar’s vlsr = 10.2 km s−1. The scalebar represents one beam width (120 au or 0″.4)
Current usage metrics show cumulative count of Article Views (full-text article views including HTML views, PDF and ePub downloads, according to the available data) and Abstracts Views on Vision4Press platform.
Data correspond to usage on the plateform after 2015. The current usage metrics is available 48-96 hours after online publication and is updated daily on week days.
Initial download of the metrics may take a while.