Fig. D.1
Download original image
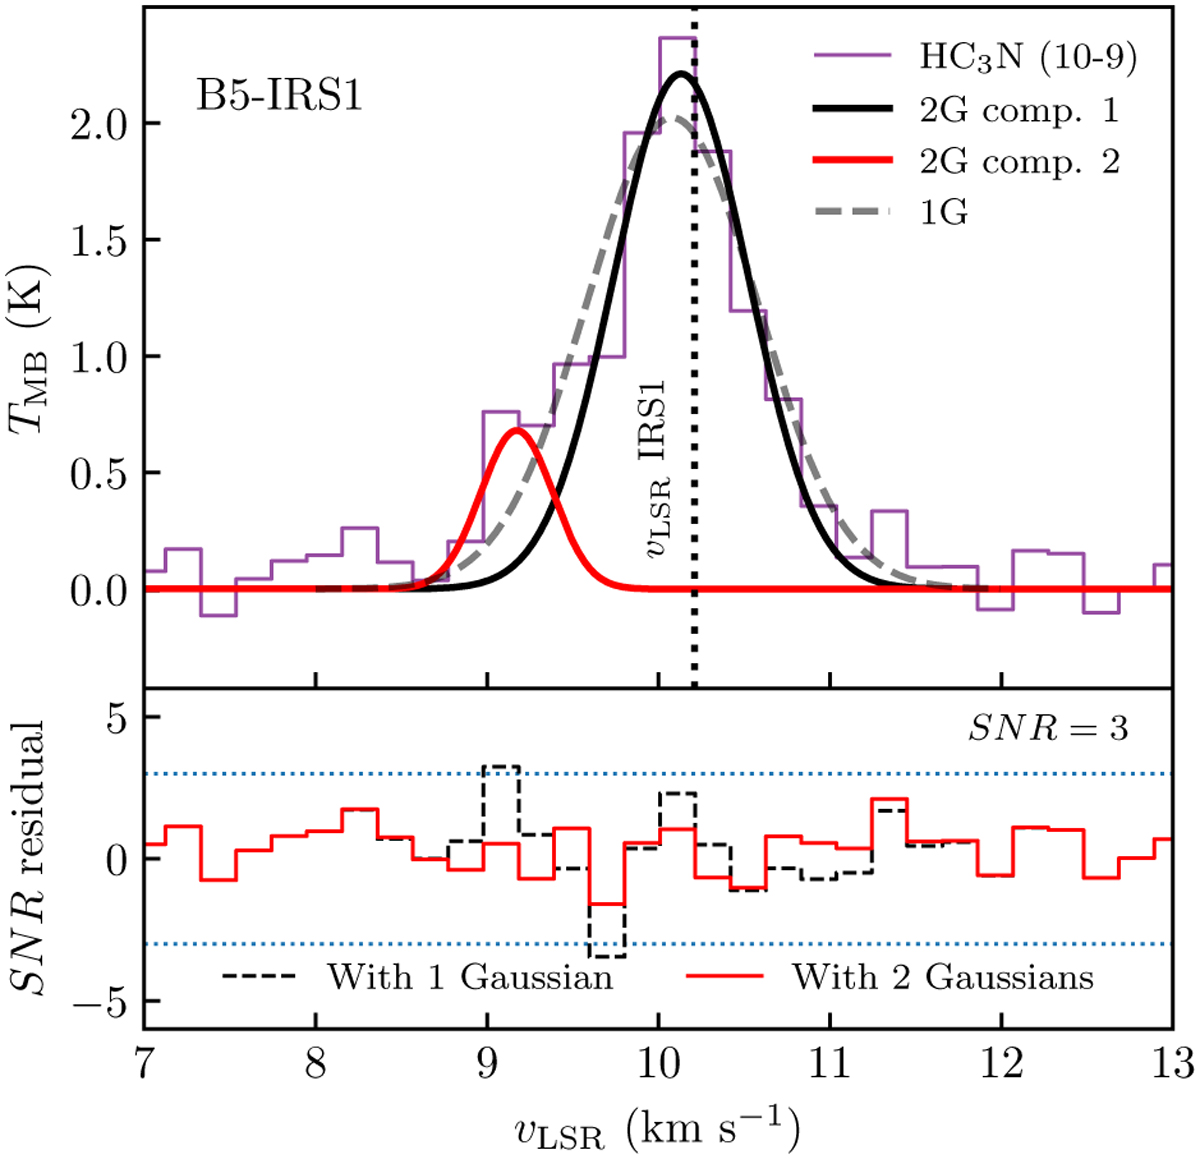
Results from the one- and two-Gaussian fit to the HC3N (10−9) emission at the position of the protostar B5-IRS1. Top: HC3N (10−9) emission spectrum at the position of B5-IRS1, together with the best fit results using one and two Gaussian curves. The vertical dashed line represents the central velocity of the protostar from P15. Bottom: residuals from the fit in terms of S/N. The dashed purple line represents the residuals after the 1 Gaussian fit, whereas the solid purple line, the residuals after the 2 Gaussian fit. The horizontal blue dashed lines mark the S/N = 3 and −3 levels.
Current usage metrics show cumulative count of Article Views (full-text article views including HTML views, PDF and ePub downloads, according to the available data) and Abstracts Views on Vision4Press platform.
Data correspond to usage on the plateform after 2015. The current usage metrics is available 48-96 hours after online publication and is updated daily on week days.
Initial download of the metrics may take a while.