Fig. C.1
Download original image
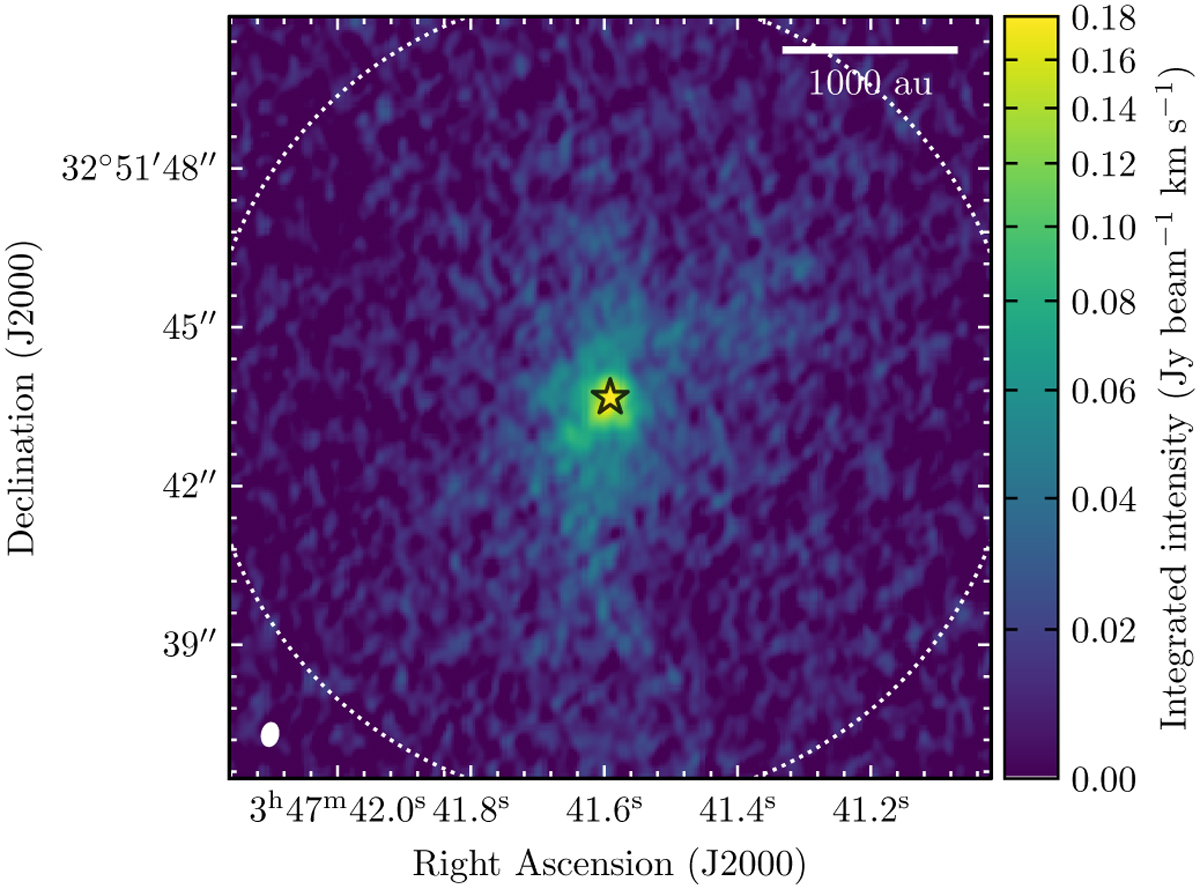
Velocity integrated image of C18O emission from 7.8 to 12.4 km s−1. We note that the area covered in the C18O map is larger than for the H2CO image, shown in Fig. 3. The black star represents the position of the protostar. The scalebar indicates a length of 1000 au. The white ellipse in the bottom left corner represents the beam size. The primary beam of the image is drawn with a white dotted circle.
Current usage metrics show cumulative count of Article Views (full-text article views including HTML views, PDF and ePub downloads, according to the available data) and Abstracts Views on Vision4Press platform.
Data correspond to usage on the plateform after 2015. The current usage metrics is available 48-96 hours after online publication and is updated daily on week days.
Initial download of the metrics may take a while.