Fig. B.1
Download original image
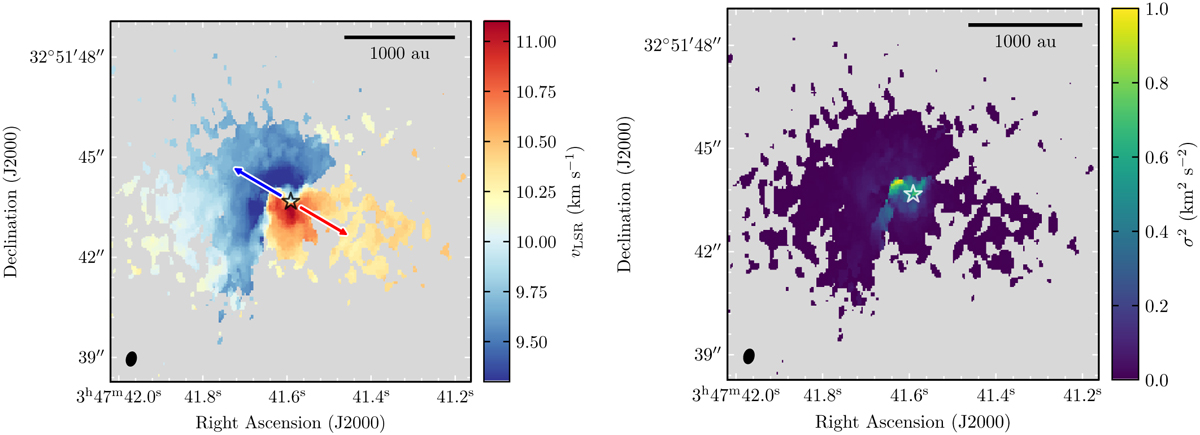
Moments 1 (left) and 2 (right) of the ALMA H2CO (30,з – 20,2) line emission. The black (left) and white (right) stars represent the position of the protostar. The blue and red arrows indicate the directions of the blue and redshifted outflow lobes from Zapata et al. (2014). The scalebars indicate a length of 1000 au. The black ellipse in the bottom left corner represents the beam size.
Current usage metrics show cumulative count of Article Views (full-text article views including HTML views, PDF and ePub downloads, according to the available data) and Abstracts Views on Vision4Press platform.
Data correspond to usage on the plateform after 2015. The current usage metrics is available 48-96 hours after online publication and is updated daily on week days.
Initial download of the metrics may take a while.