Fig. 12
Download original image
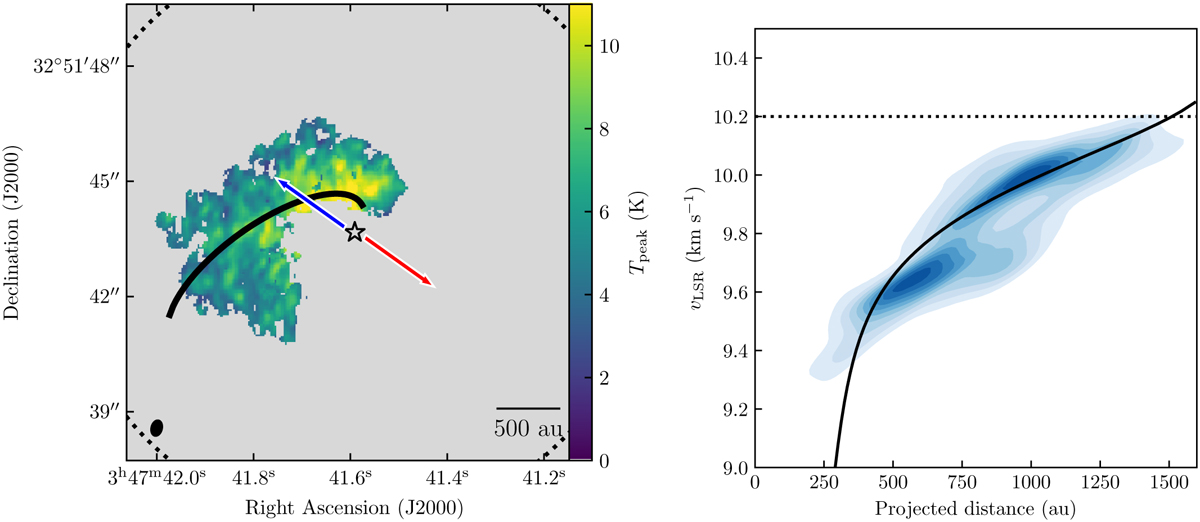
Streamline model that best fits the observed blueshifted envelope component in H2CO line emission. In both image and velocity space, the black curve represents the streamline model solution that best describes the bulk motion of the streamer. Left: peak main beam temperature Tpeak for each pixel in the blue component found with DBSCAN. The blue and red arrows show the direction of the blue and red outflow lobes from Zapata et al. (2014), respectively. The black ellipse in the bottom left corner represents the beam size. The black star represents the position of the protostar. The black dashed circle represents the size of the primary beam. Right: central velocity KDE for the blueshifted envelope plotted against the projected distance from the protostar.
Current usage metrics show cumulative count of Article Views (full-text article views including HTML views, PDF and ePub downloads, according to the available data) and Abstracts Views on Vision4Press platform.
Data correspond to usage on the plateform after 2015. The current usage metrics is available 48-96 hours after online publication and is updated daily on week days.
Initial download of the metrics may take a while.