Fig. 10
Download original image
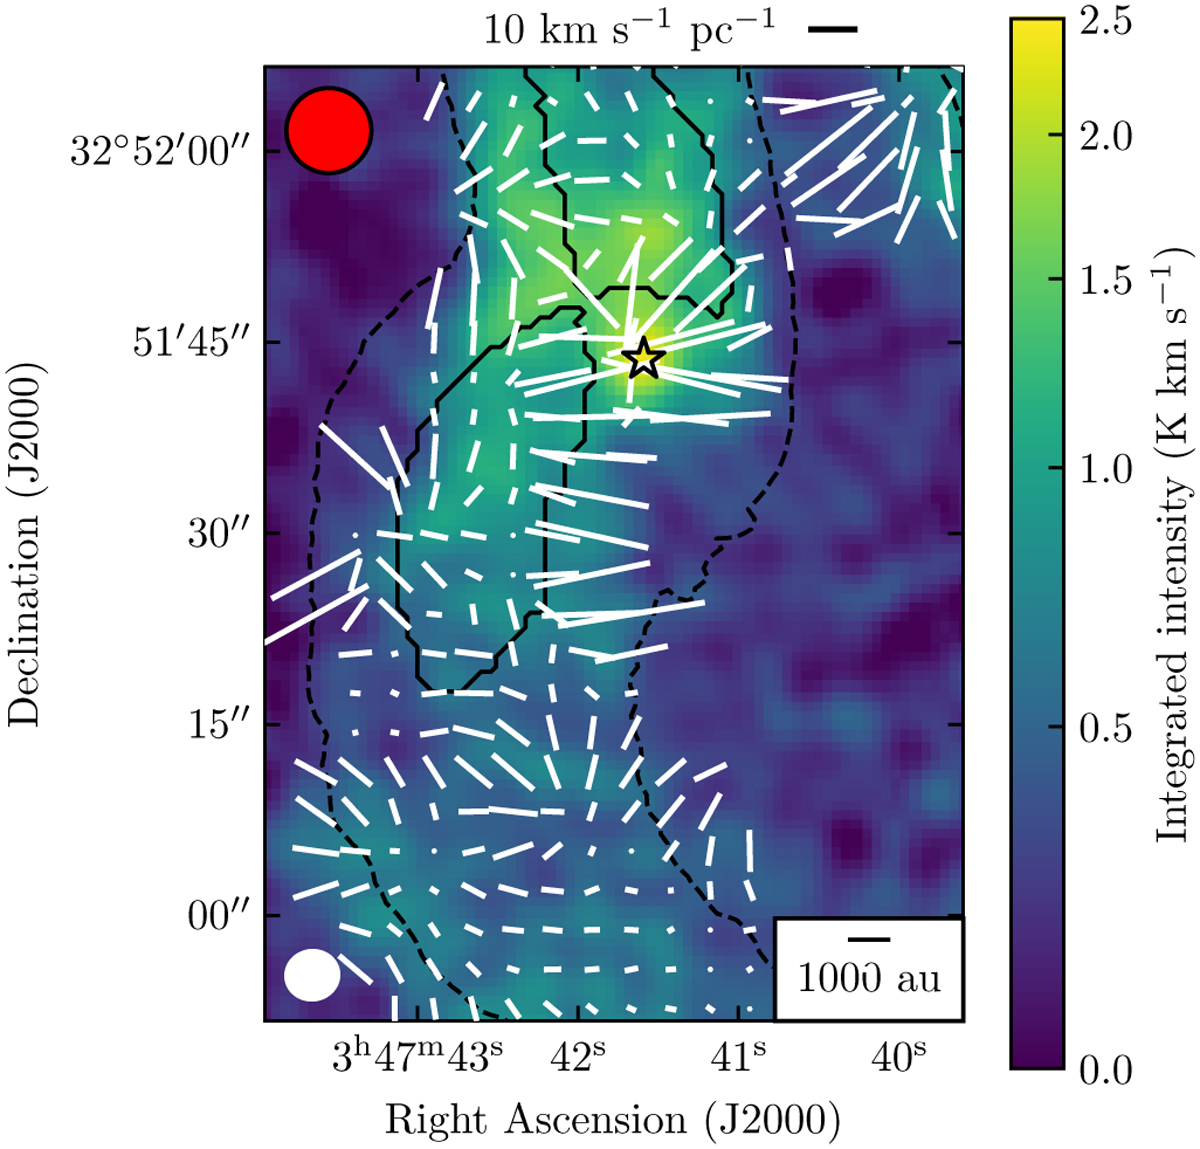
Zoom of the integrated intensity map toward Cond-2, -3 and the protostar, with the ∇vLSR vector orientations from Fig. 9 shown with white lines. The black line at the top represents a gradient magnitude of 10 km s−1 pc−1. The black star indicates the position of B5-IRS1. The white ellipse in the bottom left corner represents the beam size. Black dashed contours outline the NH3 filaments (P15; S21). Black solid contours outline the edges of the condensations (P15). The red circle at the top left corner represents the area used to calculate the gradients. The scale bar at the bottom right marks a length of 1000 au.
Current usage metrics show cumulative count of Article Views (full-text article views including HTML views, PDF and ePub downloads, according to the available data) and Abstracts Views on Vision4Press platform.
Data correspond to usage on the plateform after 2015. The current usage metrics is available 48-96 hours after online publication and is updated daily on week days.
Initial download of the metrics may take a while.