Fig. 1
Download original image
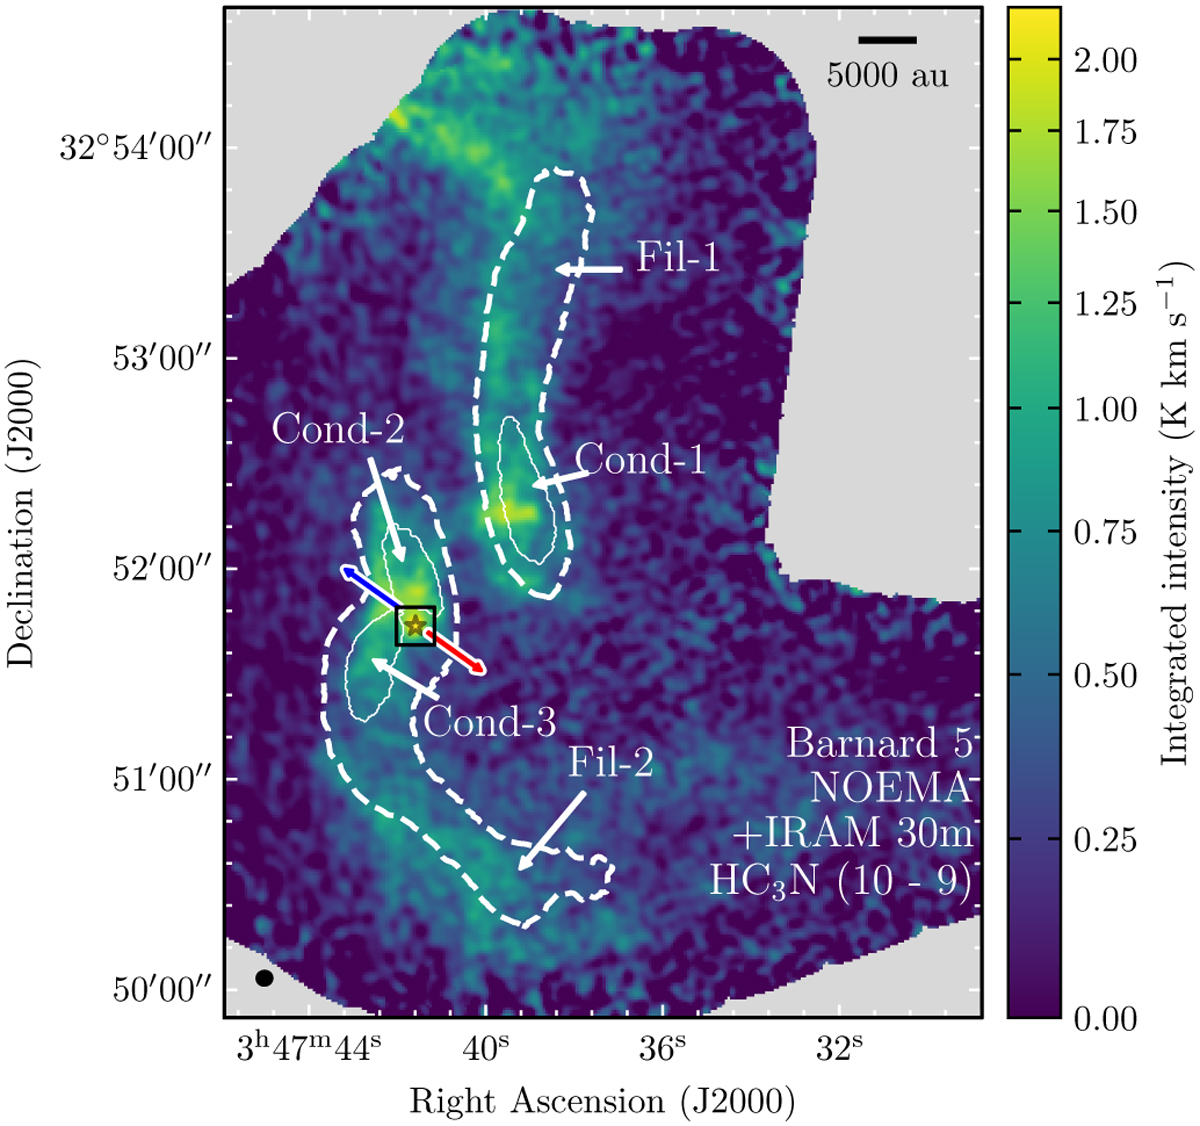
Velocity integrated HC3N (10 − 9) emission. HC3N is integrated from 9.2 to 11.2 km s−1. White dashed contours correspond to the filaments identified in NH3 emission by P15 and S21. White solid contours outline the edges of the condensations labeled as in P15. The gray star marks the position of the protostar B5-IRS1. The black square represents the area observed with ALMA. The blue and red arrows indicate the direction of the blueshifted and redshifted lobes of the outflow in B5-IRS1 (Zapata et al. 2014).
Current usage metrics show cumulative count of Article Views (full-text article views including HTML views, PDF and ePub downloads, according to the available data) and Abstracts Views on Vision4Press platform.
Data correspond to usage on the plateform after 2015. The current usage metrics is available 48-96 hours after online publication and is updated daily on week days.
Initial download of the metrics may take a while.