Fig. 8.

Download original image
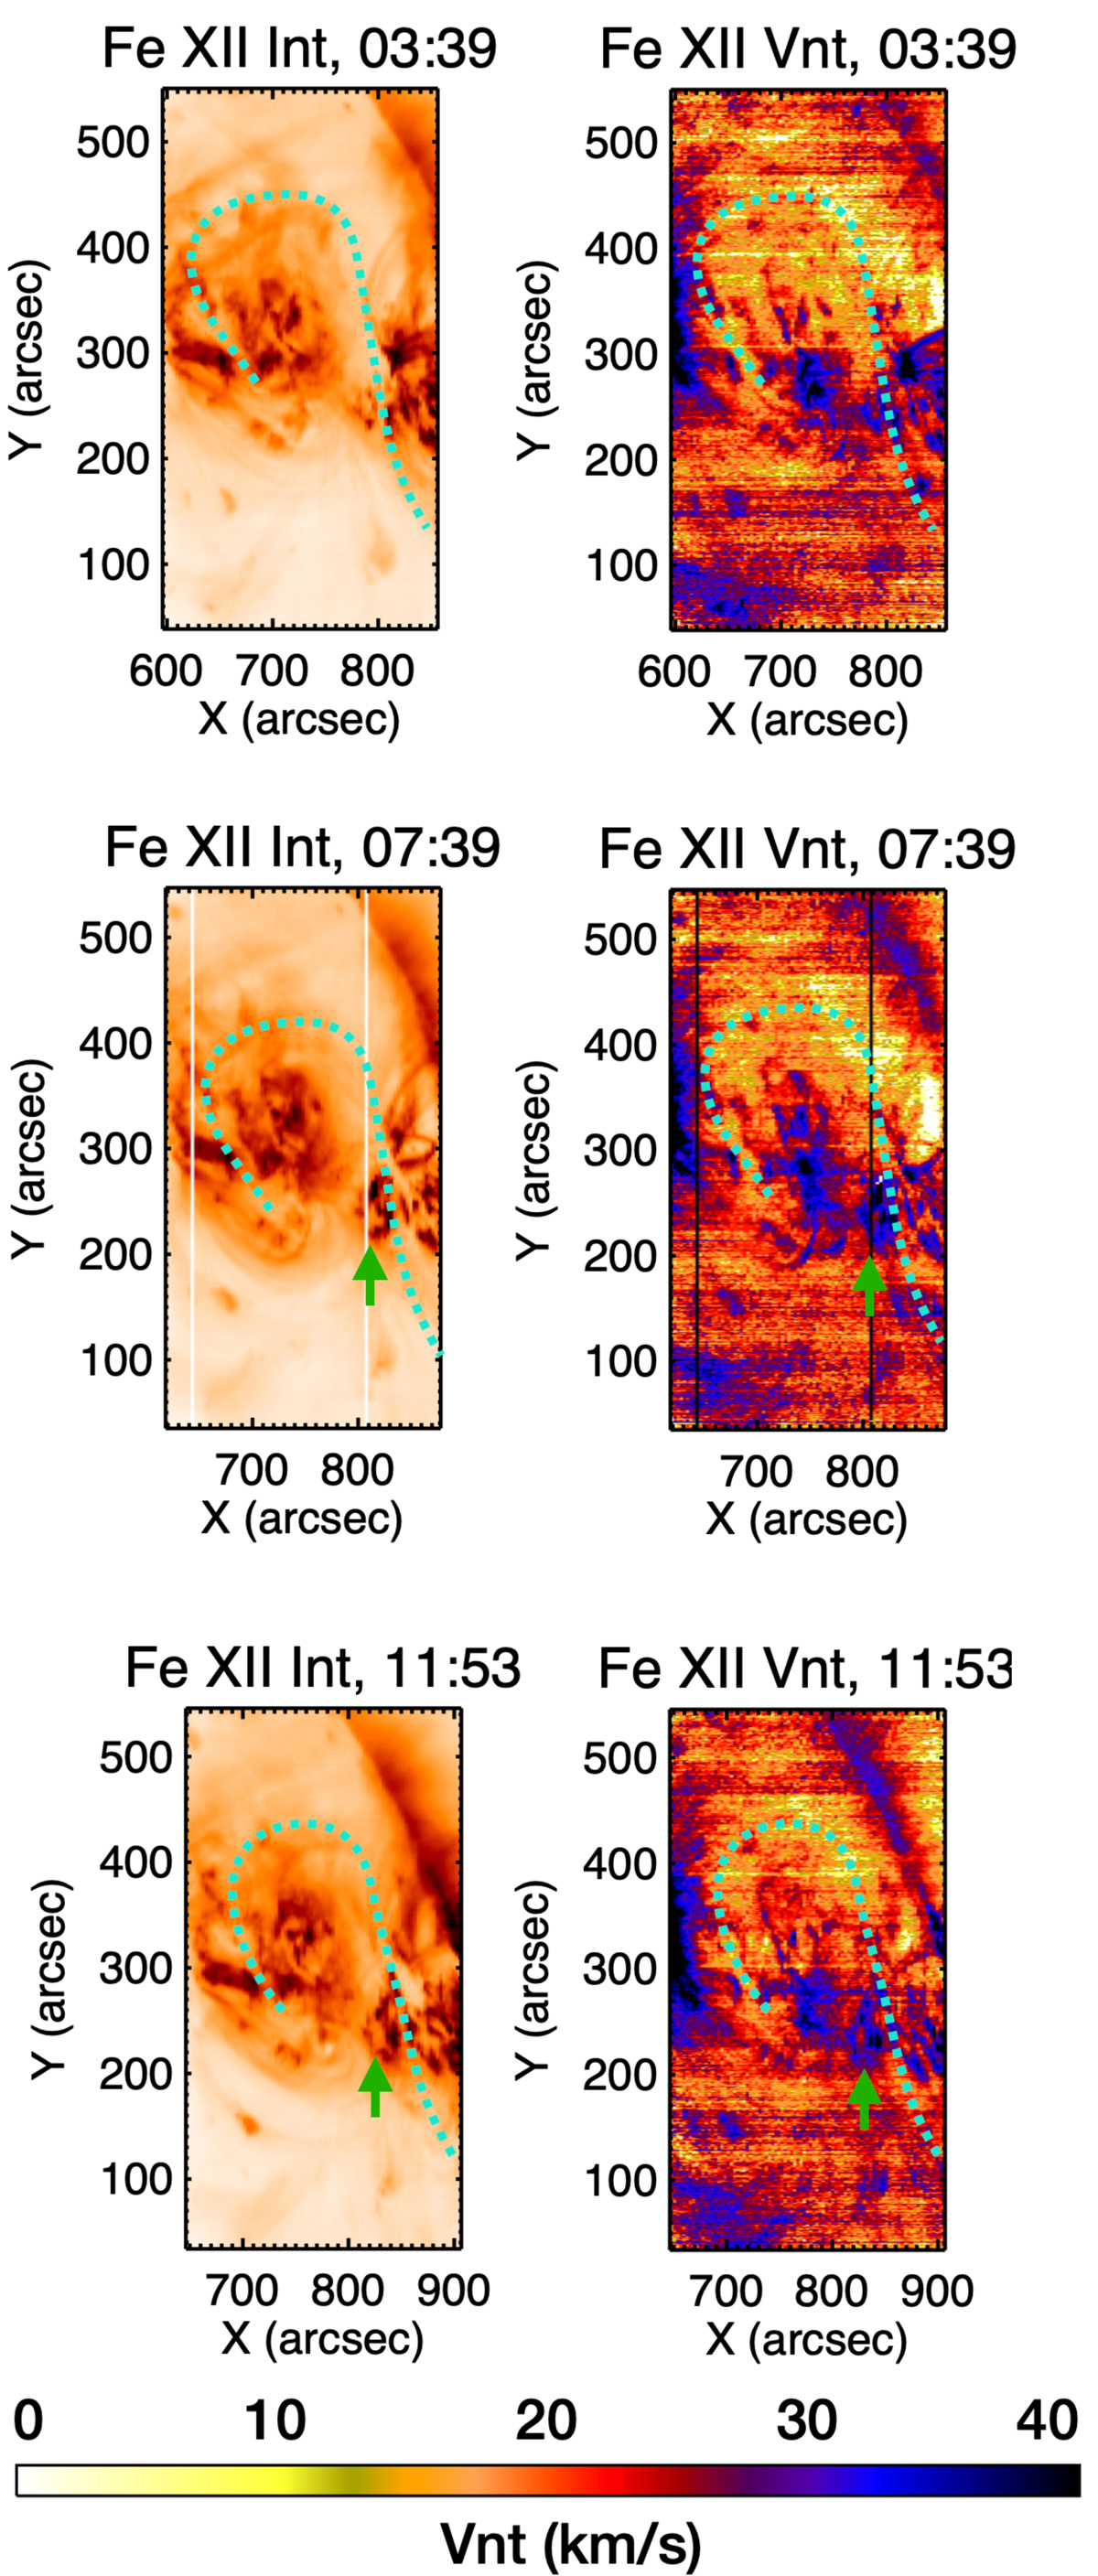
Observations from the Hinode EIS instrument in the pre-flare period. Left column: Fe XII intensity maps of the active region over 3 times using data from Hinode EIS. The rasters start at 03:39, 07:39 and 11:53 UT from top to bottom. The colour table is reversed colour, so dark is the highest intensity. The filament is seen as white (low intensity). Right column: non-thermal velocity of the Fe XII emission line for the same raster times. The filament region (indicated with cyan dotted lines) shows enhanced non-thermal velocity in each raster, as well as the emerging bipole (green arrows). The colour bar shows the ranges of the non-thermal velocity in km s−1.
Current usage metrics show cumulative count of Article Views (full-text article views including HTML views, PDF and ePub downloads, according to the available data) and Abstracts Views on Vision4Press platform.
Data correspond to usage on the plateform after 2015. The current usage metrics is available 48-96 hours after online publication and is updated daily on week days.
Initial download of the metrics may take a while.


