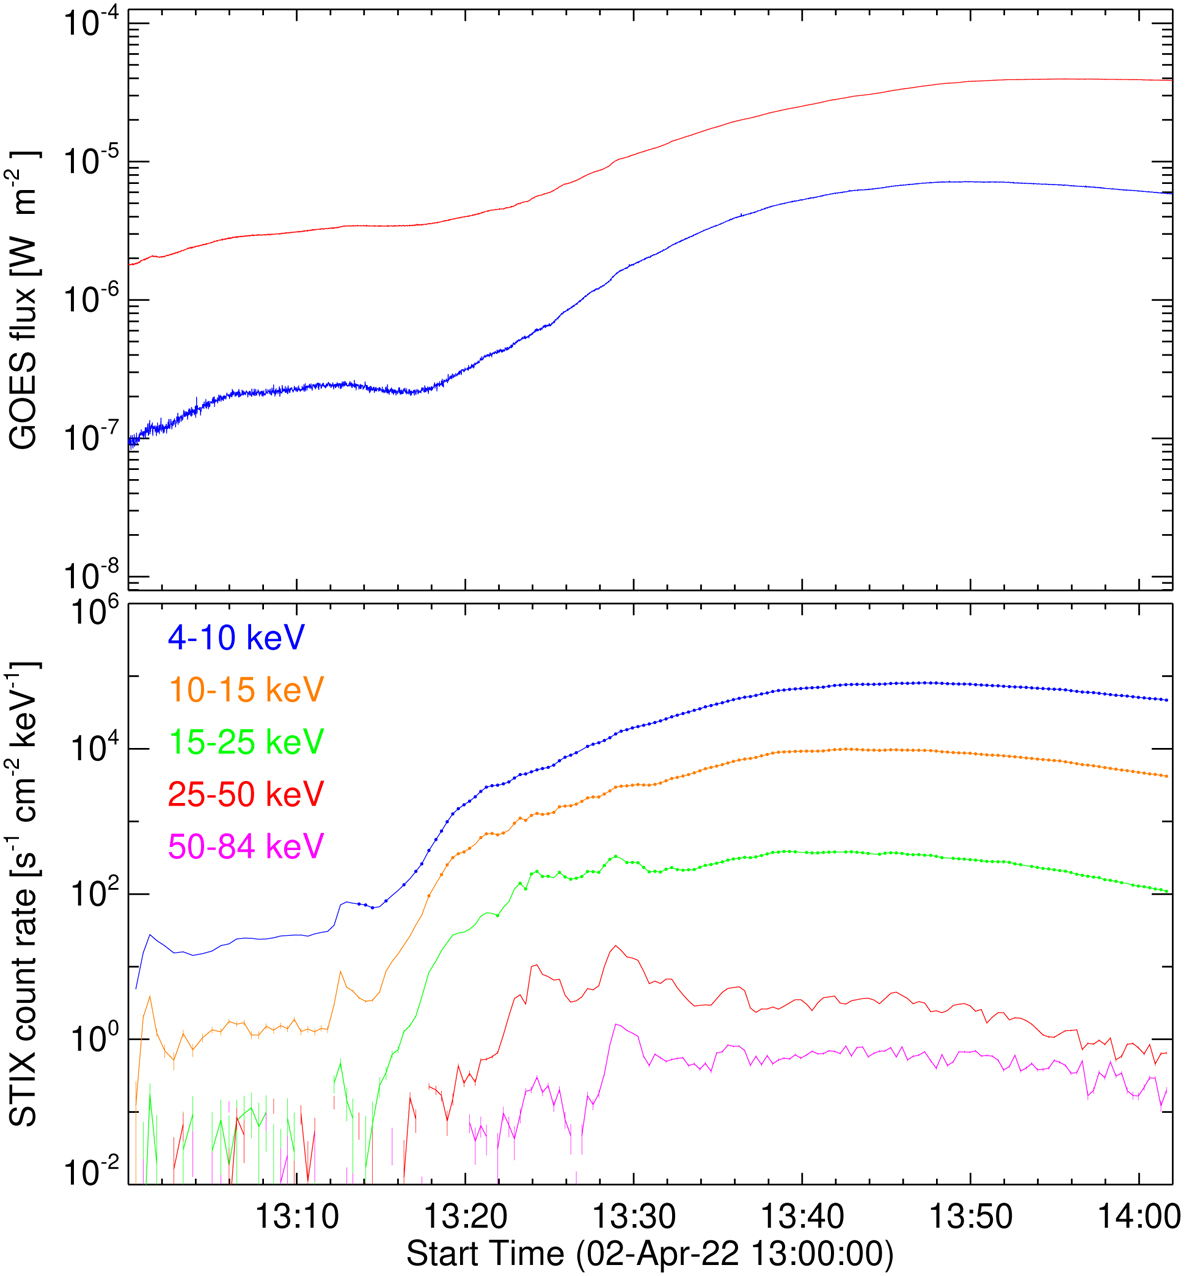
Fig. 6.

Download original image
X-ray lightcurves of the impulsive phase of the M3.9 flare. Top: GOES-16 soft X-ray fluxes. The GOES fluxes have been shifted in time to be consistent with the observations at Solar Orbiter. Bottom: STIX HXR count rates in five energy bands: three broad energy bands that are dominated by thermal emission, and two energy bands that show non-thermal emission. The vertical dotted lines indicate the three major non-thermal peaks. A pre-event background has been subtracted from all STIX count rates. The high-energy count rates after the third peak are enhanced due to a detector saturation issue.
Current usage metrics show cumulative count of Article Views (full-text article views including HTML views, PDF and ePub downloads, according to the available data) and Abstracts Views on Vision4Press platform.
Data correspond to usage on the plateform after 2015. The current usage metrics is available 48-96 hours after online publication and is updated daily on week days.
Initial download of the metrics may take a while.


