Fig. 4.

Download original image
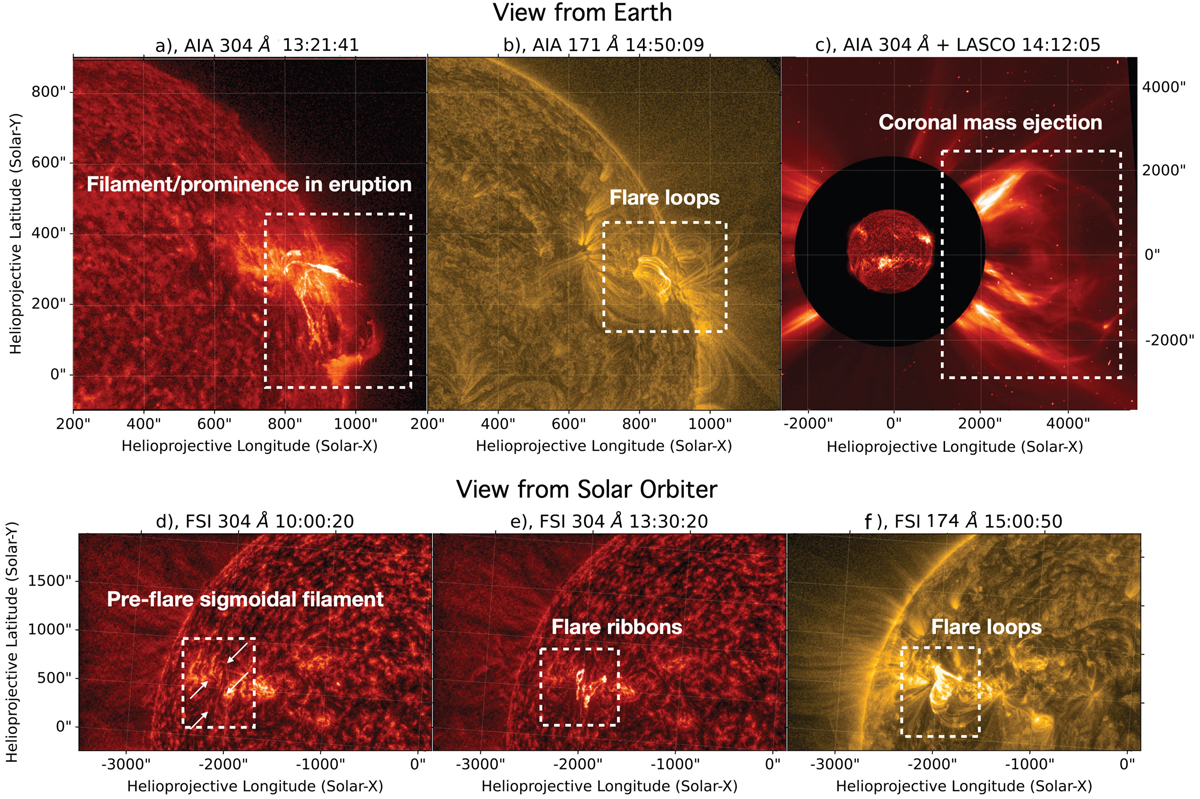
Views of the flaring region from different imagers and at different times. The SDO/AIA 304 Å image from the impulsive phase of the event shows the prominence in eruption (a) while the SDO/AIA 171 Å image from the decay phase shows the flare loops (b). The filament eruption subsequently led to a CME detected by the SOHO/LASCO C2 coronagraph (c). Times are at Earth time. The Solar Orbiter EUI-FSI 304 Å image shows the pre-flare filament and the flare ribbons (d and e), and the 174 Å image shows the flare loops (f). Times are at the observation time (321s before Earth time). The AIA images have been processed using the multi-scale Gaussian normalisation (Morgan & Druckmüller 2014).
Current usage metrics show cumulative count of Article Views (full-text article views including HTML views, PDF and ePub downloads, according to the available data) and Abstracts Views on Vision4Press platform.
Data correspond to usage on the plateform after 2015. The current usage metrics is available 48-96 hours after online publication and is updated daily on week days.
Initial download of the metrics may take a while.


