Fig. 2.

Download original image
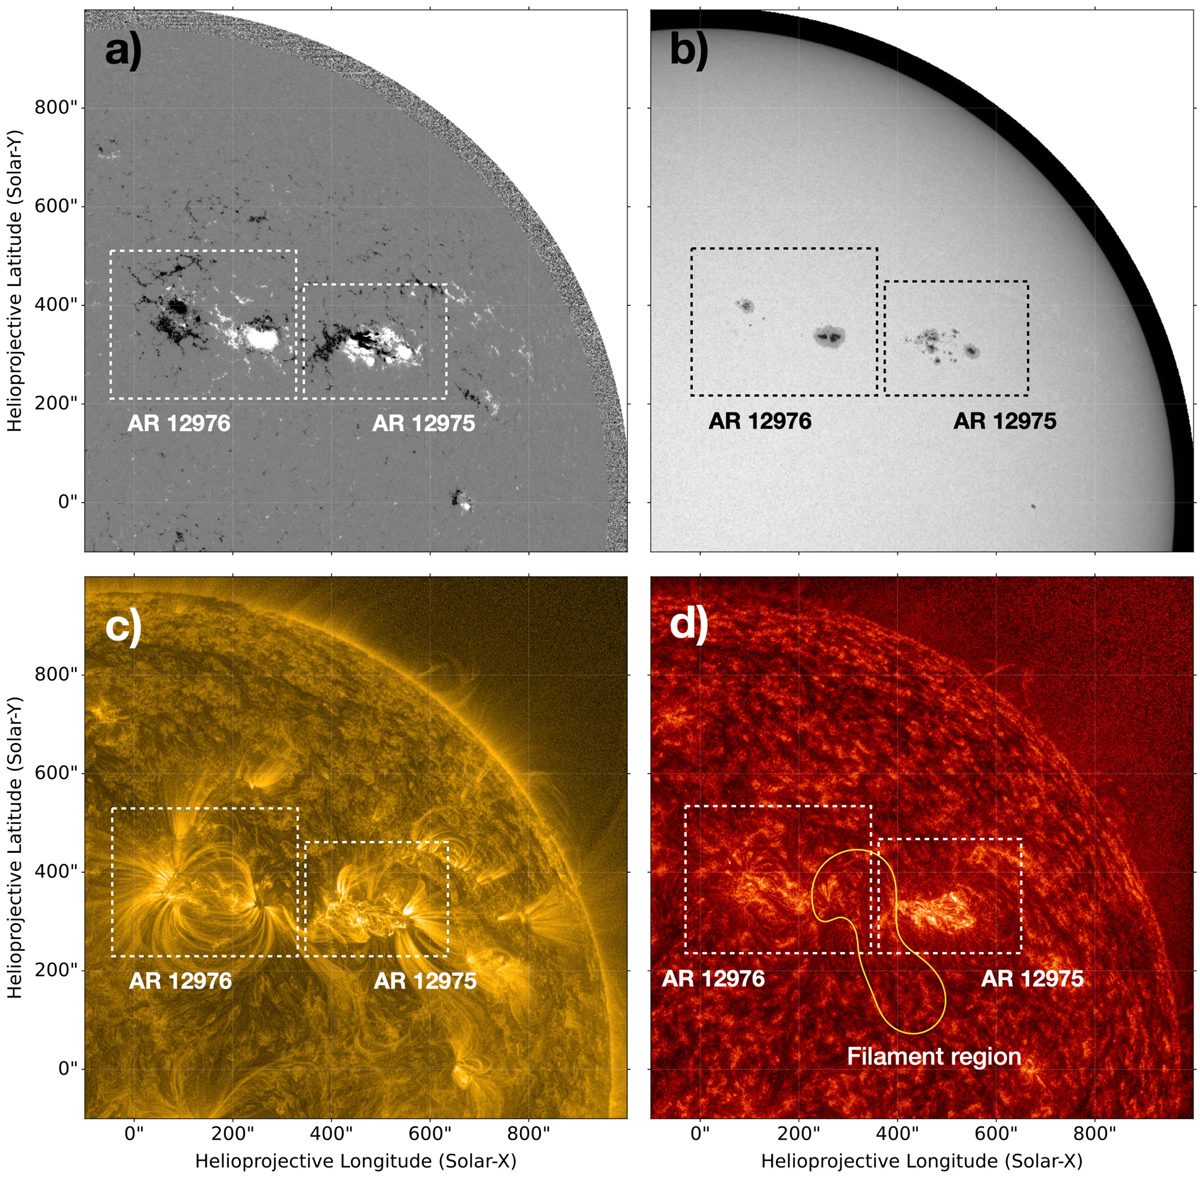
Overview of the two active regions AR 12975 and AR 12976 seen from the Sun-Earth line on 30 March 2022 during the pointing decision meeting. The different views correspond to the (a) HMI magnetogram and (b) continuum data, (c) AIA 171 Å and (d) AIA 304 Å. A filament is present in between the two regions in the AIA 304 Å image (d) (yellow contour). The AIA images have been processed using the multi-scale Gaussian normalisation (Morgan & Druckmüller 2014).
Current usage metrics show cumulative count of Article Views (full-text article views including HTML views, PDF and ePub downloads, according to the available data) and Abstracts Views on Vision4Press platform.
Data correspond to usage on the plateform after 2015. The current usage metrics is available 48-96 hours after online publication and is updated daily on week days.
Initial download of the metrics may take a while.


